
Last week's rebound has already been given back
L'Oréal slips 2.4% and falls back onto its 200-week moving average
Our view last week
After 3 down weeks L'Oréal rebounded 1.5%, and buying in the weekly bar climbed back to 34% of volume, up from 2% a week earlier. The recovery is still in the minority, though: sellers hold 66% of the volume, the weekly MACD remains below its Signal line and money flow has been falling for 4 weeks. L'Oréal stock is working inside a very tight corridor between its 50-day moving average and the daily VWMA: indecisive price action, a swing trading setup to follow with patience.
This week's summary
Last week's rebound is already gone: L'Oréal slipped 2.4% and is back right on top of its 200-week average, in the 372 area, which is holding for now. Underneath, the picture is getting weaker: the weekly MACD is pulling further below its Signal line and money flow has been deteriorating for 5 weeks. Among European stocks, L'Oréal stock stays in a buy signal with little drive, ADX at 15: on technical analysis, a swing trading setup for the patient, hinging on that support.
IQS Phase
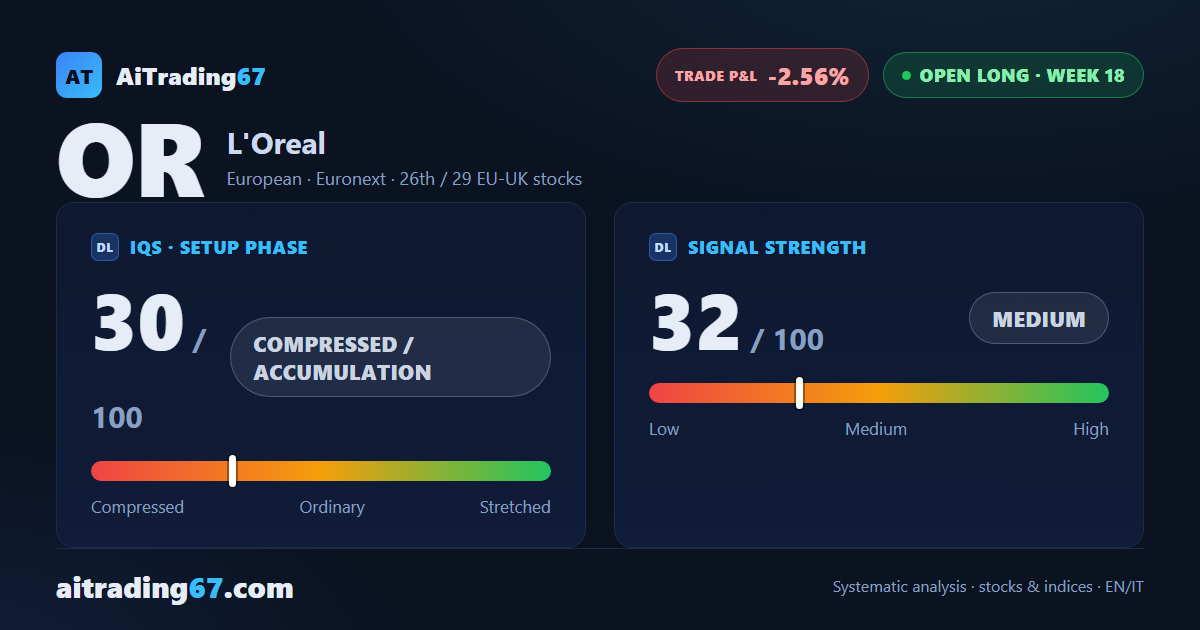
30
compressed / accumulation
Signal Strength
32
medium · weak
Sizing
REDUCED
Ranking
#26 / 29
EU-UK stocks in progress
Trade P&L %
-2.56%
from signal to date, no stop loss
L'Oreal (OR) weekly chart — EMA50 · MACD · VWAP
Weekly chart · EMA50 · MACD · VWAP · Source: TradingView
Rank position
ranks 26th among the 29 Longs already running for European-UK stocks in our ranking, with a signal strength of 32 out of 100.
Sector context
SectorEuropean
Benchmark ETFEXH7
Sector regime
Performanceweekly coming soon · monthly coming soon
OR belongs to the european sector (reference ETF EXH7).
restricted Platinum content