
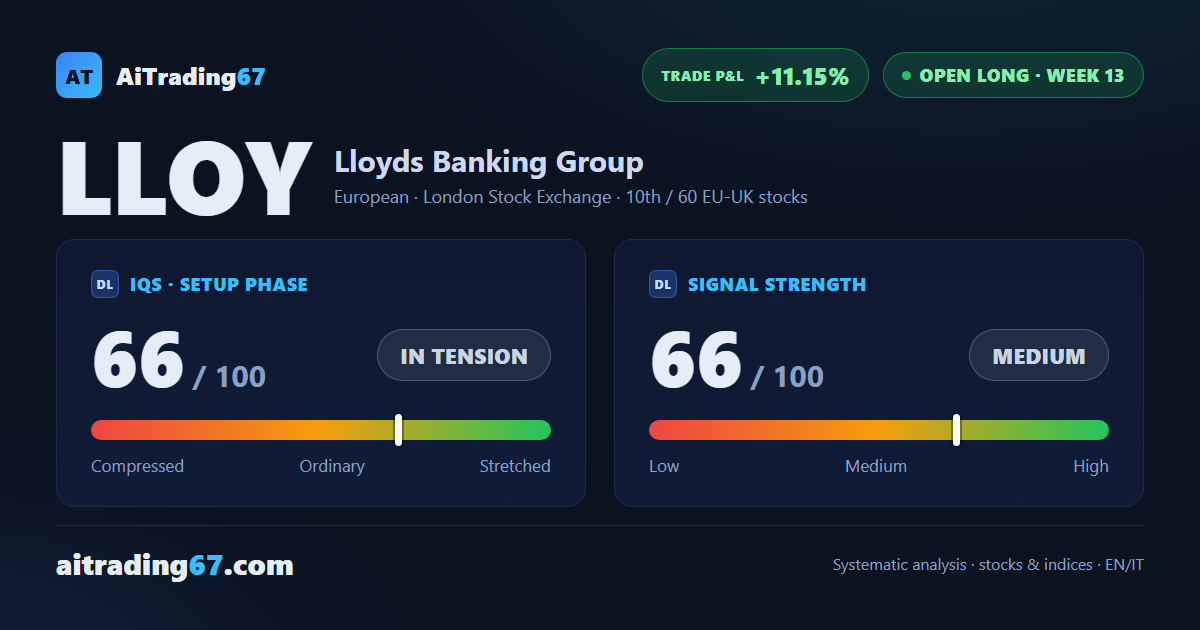
Buy signal in week 13, +11.15% since entry
Lloyds Banking Group slips 2.5% after rejection at its 7-day high
Buy signal in week 13, +11.15% since entry
Our view last week
Lloyds Banking Group is in week 12 of a buy signal that has exhausted the model's coverage: all 3 statistical targets have been hit and the stop now follows the Inversion Point, in the 106 area. The trade is running at +14.02% from entry. On the technical side, the week closed up 5.4% with buy volume at 95%, while price stays compressed between the first resistance and the first support.
This week's summary
Lloyds Banking Group gave back 2.5% this week after a firm rejection at its 7-day high, in the 116 area: sellers took charge again, with buy volume slipping to just 30% versus 95% the week before. Money flow stays positive and the weekly MACD keeps improving, a sign of a pause inside the uptrend. The buy signal is now in its 13th week, with the gain down to +11.15% since entry.
IQS Phase
66
in tension
Signal Strength
66
medium
Sizing
STANDARD
Ranking
#10 / 60
EU-UK stocks in progress
Trade P&L %
+11.15%
from signal to today
restricted Platinum content