
Sell signal · week 3 · EU-UK stocks
Lloyds Banking Group drops 4.4% to a new 30-day low, yet the 200-day average holds
Our view last week
A flat week, closed down 0.1%, and the Sell signal's strength collapses from 41 to 7 out of 100: the decline that fired seven days ago has found no fresh push. On Lloyds Banking Group stock the price action shows an indecisive phase, with buyers back in front on the week's volume and money flow still below zero. The technical analysis has the price above its 50-week average: opening a short here remains a high-risk trade setup among UK bank stocks.
This week's summary
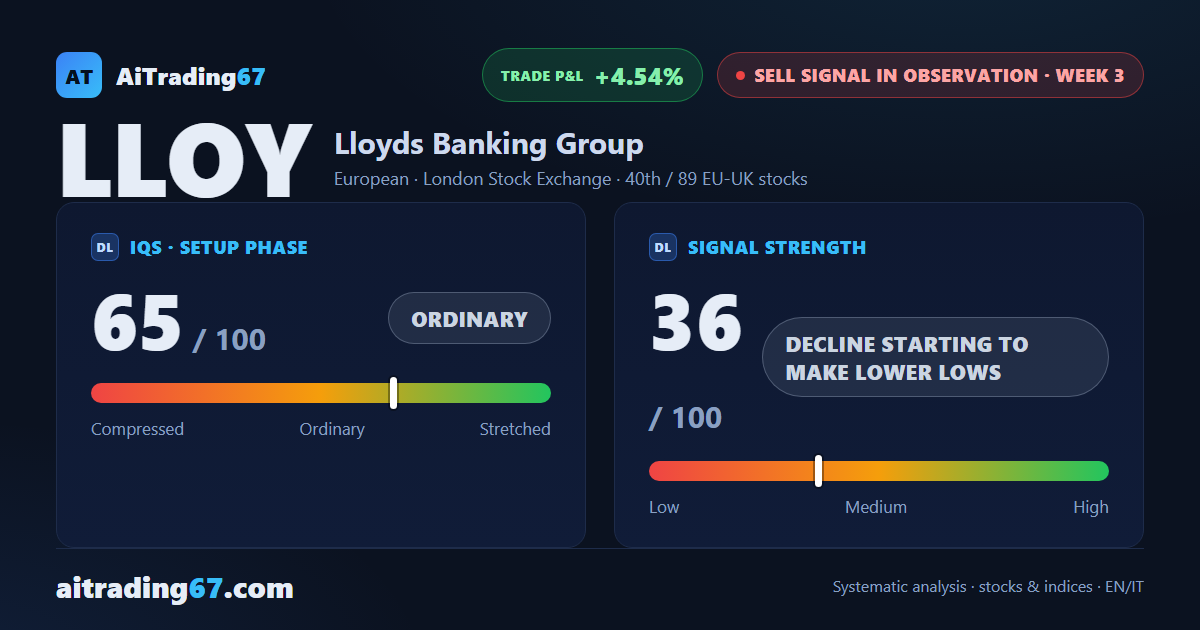
A 4th straight weekly decline, and this one bites: down 4.4%, with a new 30-day low confirmed by the weekly close. Lloyds Banking Group stock is back in step with a decline that looked spent 7 days ago, and the Sell signal's strength once again describes a decline starting to make lower lows. The technical analysis still urges caution on this trade setup: price holds above its 50-week average and the last session closed at its high, back above the 200-day moving average.
IQS Phase
65
ordinary
Signal Strength
36
decline starting to make lower lows
Sizing
REDUCED
Ranking
#40 / 89
EU-UK stocks sell signals
Trade P&L %
+4.54%
from signal to date, no stop loss
Lloyds Banking (LLOY) weekly chart — EMA50 · MACD · VWAP
Weekly chart · EMA50 · MACD · VWAP · Source: TradingView
Rank position
ranks 40th among the 89 sell signals for European-UK stocks in our ranking, with a signal strength of 36 out of 100.
Sector context
SectorEuropean
Benchmark ETFEXV1
Sector regimeweak phase
Performanceweekly -4.91% · monthly -4.92%
LLOY belongs to the european sector (reference ETF EXV1). The sector is classified weak phase according to our weekly reading.
restricted Platinum content