
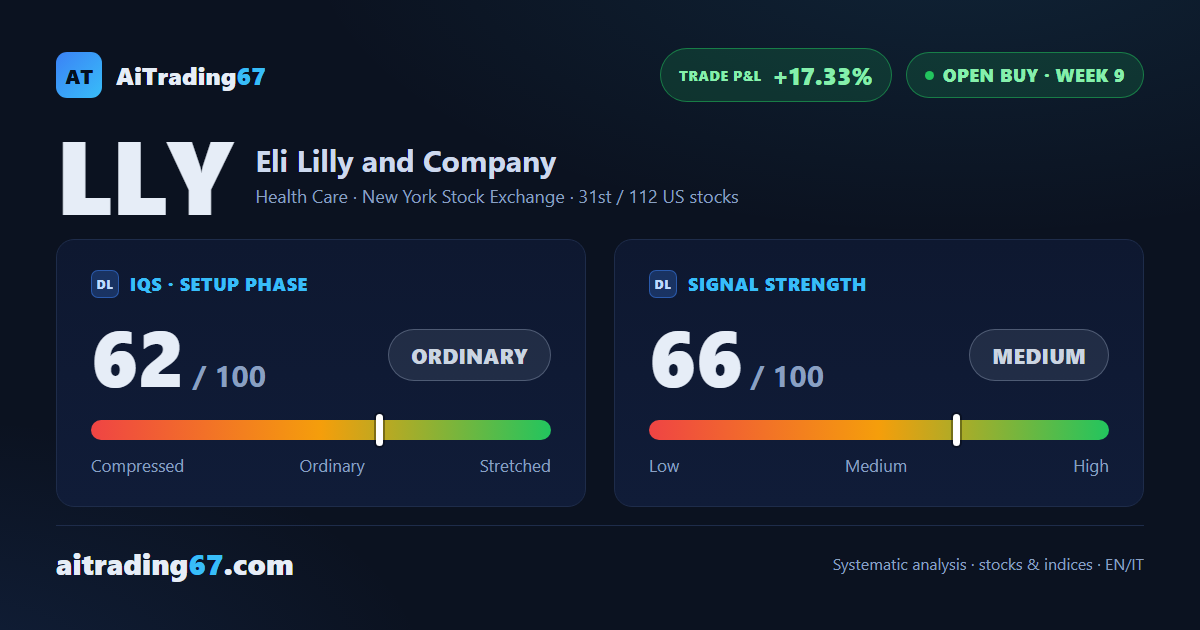
Buy signal in its 9th week, trade up more than 17%
Eli Lilly slips 0.8%, but the double bottom holds and the trend gains conviction
Buy signal in its 9th week, trade up more than 17%
Our view last week
Eli Lilly shares slipped 2.1% in a week where sellers took control and buyer dominance clearly retreated: a warning flag inside a trend that otherwise stays solid — the weekly moving averages are all aligned higher and the ADX is climbing. The stock is still hugging its all-time highs, already tested twice without breaking through: a direct entry is risky, and discipline calls for waiting on a pullback. The trade, in its 8th week, remains up more than 18%.
This week's summary
Eli Lilly shares slip 0.8% in a cautious week — volumes contracting, mixed rejection bars — but underneath, the picture holds: a double bottom in the 1090 area has already delivered a 10% rebound, and the weekly ADX is climbing, a sign the trend is gaining conviction. This week's technical analysis finds the buy signal in its 9th week, with the trade up more than 17%.
IQS Phase
62
ordinary
Signal Strength
66
medium
Sizing
STANDARD
Ranking
#31 / 112
US stocks in progress
Trade P&L %
+17.33%
from signal to today
restricted Platinum content