
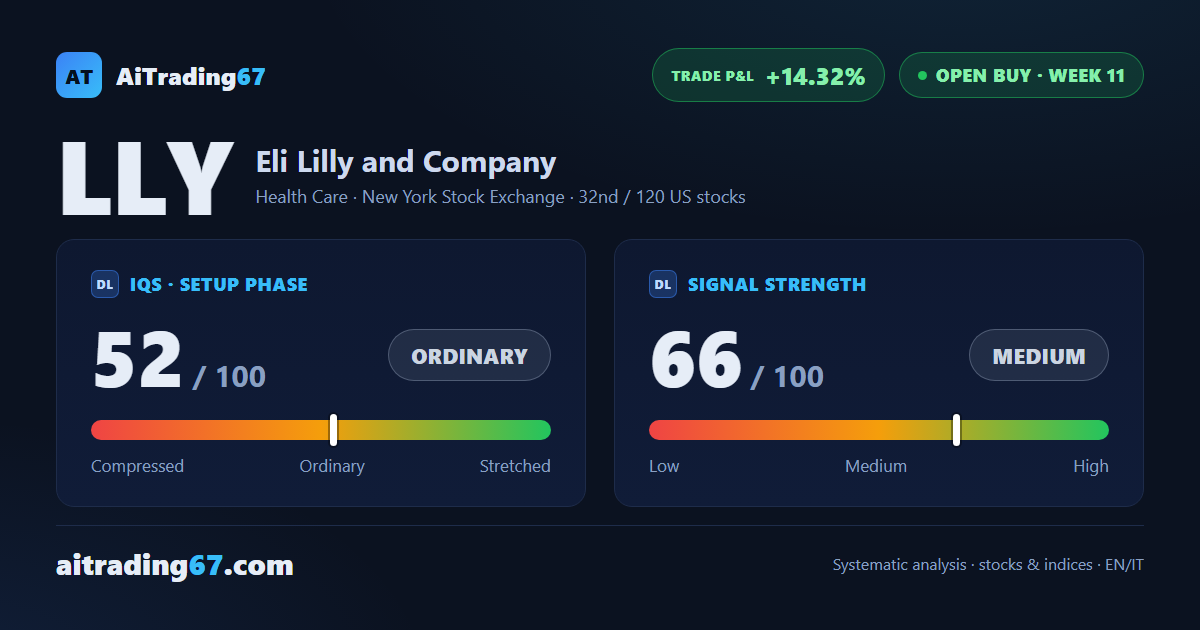
Buy signal in its 11th week, trade at +14.3%
Eli Lilly falls 3.9%, but the daily chart keeps posting higher lows
Buy signal in its 11th week, trade at +14.3%
Our view last week
Eli Lilly shares close the week up 1.4%, rebounding 4% off the daily EMA20 after a touch in the 1150 area. The buy signal is in its 10th week and the trade is running at +19% since entry, but the stock is hugging its all-time highs, already tested multiple times: little room to run without a pullback. This week's technical analysis shows the structure still bullish, with the weekly ADX climbing.
This week's summary
Eli Lilly shares fall 3.9% this week, with four warning flags in the weekly read — contracting volumes, mixed rejection bars, sellers slightly ahead in the last session. On the daily chart though the picture stays constructive: four higher lows in a row, from the 1130 area toward the 1180 area. The buy signal is in its 11th week and the trade is running at +14.3% since entry, with earnings due this very week.
IQS Phase
52
ordinary
Signal Strength
66
medium
Sizing
STANDARD
Ranking
#32 / 120
US stocks in progress
Trade P&L %
+14.32%
from signal to date, no stop loss
Rank position
ranks 32nd among the 120 Longs already running for US stocks in our ranking, with a signal strength of 66 out of 100.
Sector context
SectorHealth Care
Benchmark ETFXLV
Sector regimein positive regime
Performanceweekly -0.01% · monthly +1.89%
LLY belongs to the health care sector (reference ETF XLV). The sector is classified in positive regime according to our weekly reading.
restricted Platinum content