
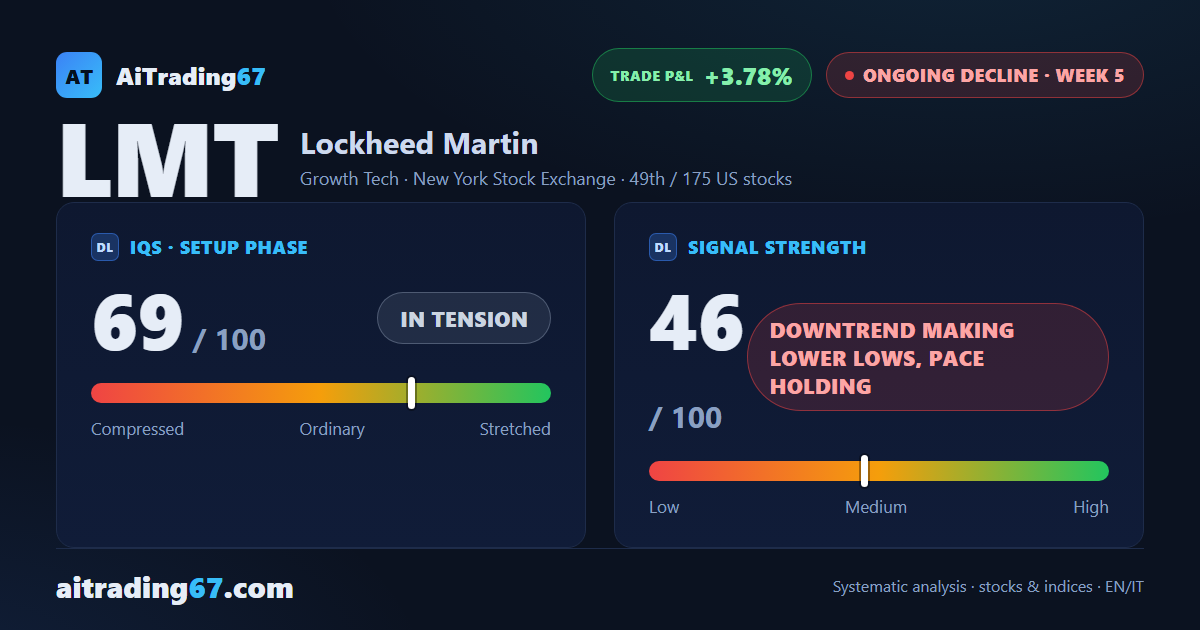
Sell signal, week 5: the decline picks up pace
Lockheed Martin falls 2.7%: fresh 30-day low as money flow turns negative
Our view last week
After last week's rebound, sellers are back in control: Lockheed Martin fell 2.6%, with buying below 25% of volume in the weekly bar and the 100-week average turning the price away. In this technical analysis of Lockheed Martin stock, the price action turns bearish again, below the 50-week average and the Ichimoku cloud, and the sell signal stays under watch: three sideways weeks have not confirmed it yet.
This week's summary
A fresh 30-day low, confirmed by the weekly close: Lockheed Martin fell 2.7% and, after a sideways start, the decline is picking up pace. In this technical analysis of Lockheed Martin stock, money flow is back in negative territory, the MACD is widening its gap below the Signal line and the 100-week average, in the 522 area, turned the price away. Price action stays bearish: for swing trading on US stocks, the supports to watch sit in the 491 and 487 areas, in week 5 of the Sell signal.
IQS Phase
69
in tension
Signal Strength
46
downtrend making lower lows, pace holding
Sizing
REDUCED
Ranking
#49 / 175
US stocks
Trade P&L %
+3.78%
from signal to date, no stop loss
Lockheed Martin (LMT) weekly chart — EMA50 · MACD · VWAP
Weekly chart · EMA50 · MACD · VWAP · Source: TradingView
Rank position
ranks 49th among the 175 sell signals for US stocks in our ranking, with a signal strength of 46 out of 100.
Sector context
SectorGrowth Tech
Benchmark ETFXLK
Sector regimein strong phase
Performanceweekly +1.80% · monthly +8.83%
LMT belongs to the growth tech sector (reference ETF XLK). The sector is classified in strong phase according to our weekly reading.
restricted Platinum content