
Open buy · week 3 · Borsa Italiana (Milan)
Lottomatica loses 4.2% and tests its 20-week average, which holds on the close
Our view last week
On the daily chart, the run of 4 higher lows Lottomatica stock had built since early September has broken: on Sep 24 a close fell below the last low. The week after the confirmation lost 2%, with sellers extremely dominant in the weekly bar. The MACD, back above its Signal line since last week, is holding, but the price action says the buy signal comes out of its confirmation weakened, 6.2% below the all-time high.
This week's summary
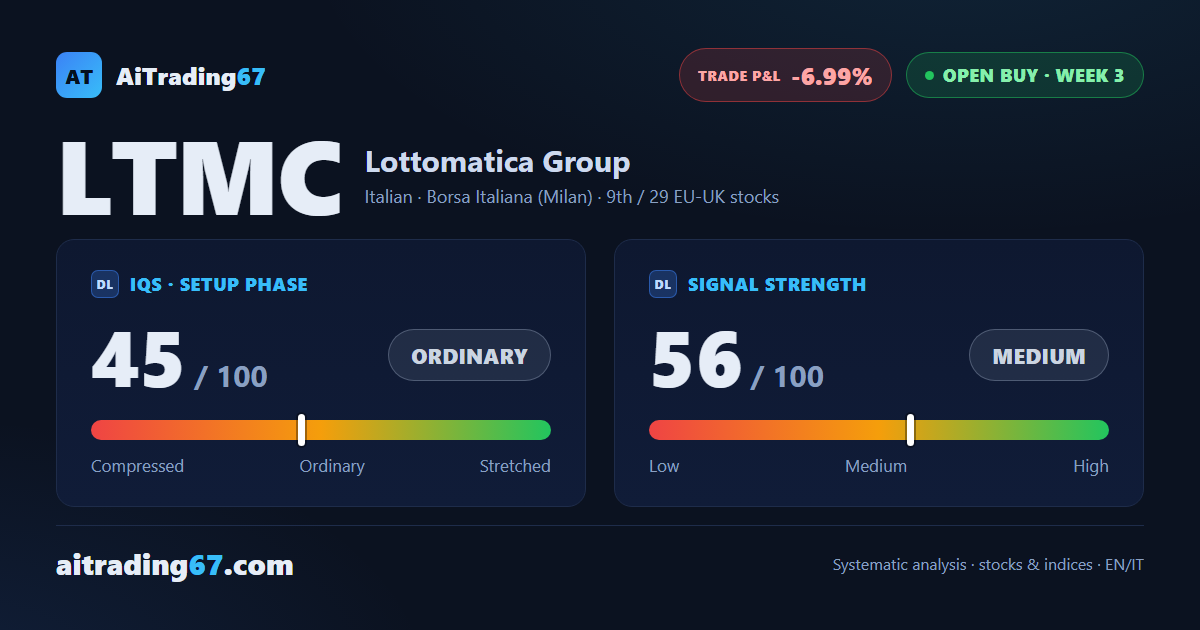
A third straight weekly decline for Lottomatica: the stock drops 4.2% and slides to its 20-week moving average, in the 25.4 area, a level it touched and held on the close. A week ago the run of higher lows on the daily chart broke; now the weekly ADX has been falling for 4 weeks and the MACD histogram turns lower again. On technical analysis, Lottomatica stock sits in a fading buy signal, 10% below its all-time high: the price action calls for caution in swing trading.
IQS Phase
45
ordinary
Signal Strength
56
medium
Sizing
STANDARD
Ranking
#9 / 29
EU-UK stocks in progress
Trade P&L %
-6.99%
from signal to date, no stop loss
Lottomatica (LTMC) weekly chart — EMA50 · MACD · VWAP
Weekly chart · EMA50 · MACD · VWAP · Source: TradingView
Rank position
ranks 9th among the 29 Longs already running for European-UK stocks in our ranking, with a signal strength of 56 out of 100.
Sector context
SectorItalian
Benchmark ETFXLY
Sector regimeweak phase
Performanceweekly -0.47% · monthly -4.20%
LTMC belongs to the italian sector (reference ETF XLY). The sector is classified weak phase according to our weekly reading.
restricted Platinum content