
Legrand slips 3.8%, retests double bottom
Legrand slips 3.8% and retests its double bottom in the 133 area
Legrand slips 3.8%, retests double bottom
Our view last week
Legrand's Sell signal is in its sixth week, and this week's technical picture tells the same story as recent weeks: the stock closes with another modest drop, 1.8%, without ever speeding up. Money flow keeps sliding into selling and momentum stays negative, while on the daily chart the stock has strung together five lower highs toward the 145 area. Price still holds above the Ichimoku cloud on the weekly chart, though: the underlying structure holds.
This week's summary
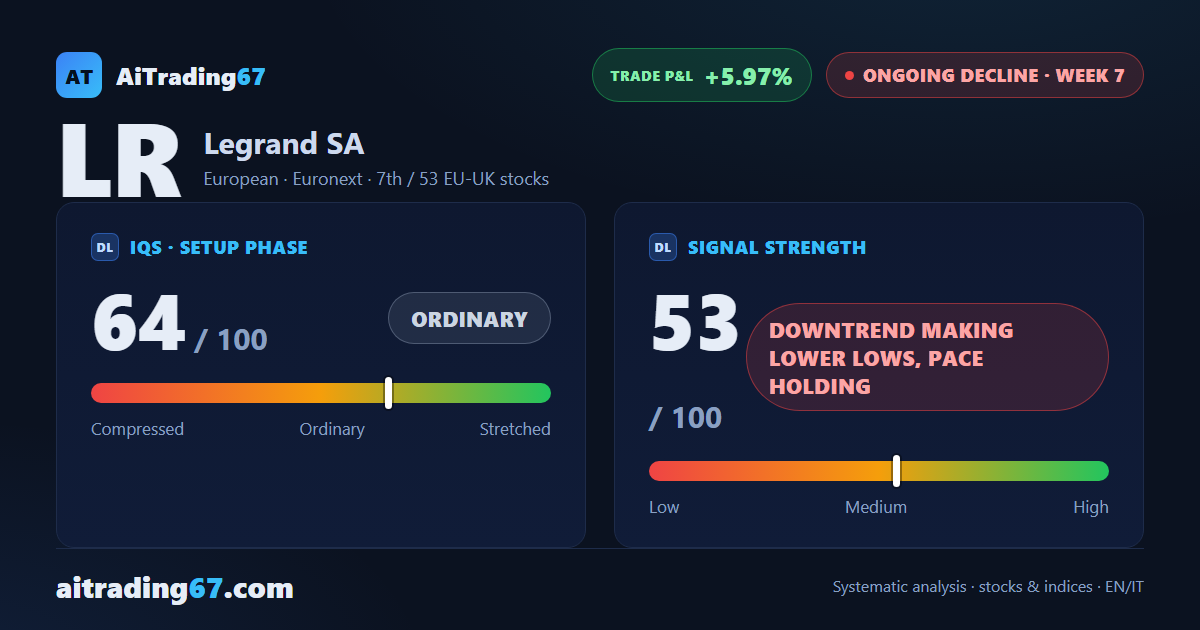
Legrand's stock drops 3.8% this week and retests its double bottom in the 133 area, rejected firmly: the price closes boxed between the 50-week average just overhead and the Bollinger Band floor just below. The Sell signal has been under management for 7 weeks, with the short above 5.9% profit; the ADX easing off, though, says the pace is loosening.
IQS Phase
64
ordinary
Signal Strength
53
downtrend making lower lows, pace holding
Sizing
STANDARD
Ranking
#7 / 53
EU-UK stocks
Trade P&L %
+5.97%
from signal to today
restricted Platinum content