
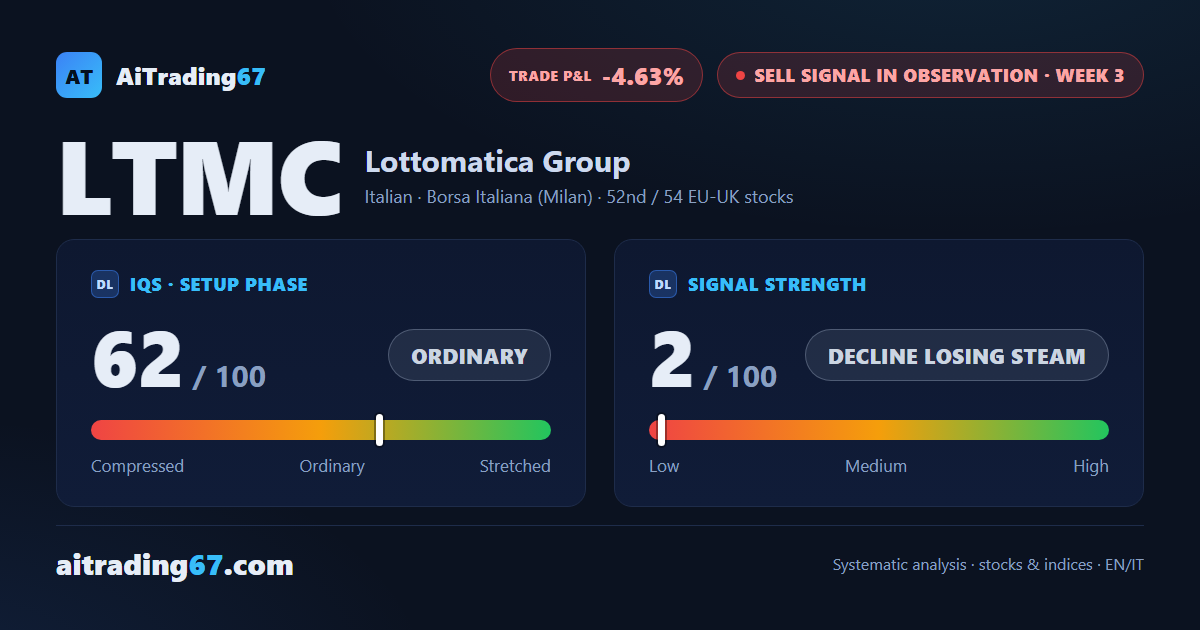
Signal strength collapses to 2 out of 100
Lottomatica bounces 1.1% as its Sell signal sinks to 52nd place
Signal strength collapses to 2 out of 100
Our view last week
Lottomatica is in the second week of a sell signal, ranking 18th among the 54 sell signals for European-UK stocks. The week that just closed bounced 3.5%, an isolated rebound that doesn't undo the underlying bearish setup. The stock still trades 53.4% above its 200-week average: the quality band flags trading as not recommended.
This week's summary
The Sell signal on Lottomatica has lost all its push: signal strength collapses to 2 out of 100 after a second bounce week in a row, +1.1%. The stock is still 54.2% above its 200-week average, now boxed into a tight range between daily resistance and support. In this week's technical analysis, Lottomatica slides to 52nd among the 54 European sell signals.
Sell signal in observation
·3rd week from start
·EU-UK stocks
·T2
·📅 Earnings · Jul 29
★ See Gold version →
IQS Phase
62
ordinary
Signal Strength
2
decline losing steam
Sizing
MINIMUM
Ranking
#52 / 54
EU-UK stocks sell signals
Trade P&L %
-4.63%
from signal to today
restricted Platinum content