
Lottomatica: the decline regains its stride
Lottomatica drops 2.6% as the sell signal returns to lower lows
Lottomatica: the decline regains its stride
Our view last week
The Sell signal on Lottomatica has lost all its push: signal strength collapses to 2 out of 100 after a second bounce week in a row, +1.1%. The stock is still 54.2% above its 200-week average, now boxed into a tight range between daily resistance and support. In this week's technical analysis, Lottomatica slides to 52nd among the 54 European sell signals.
This week's summary
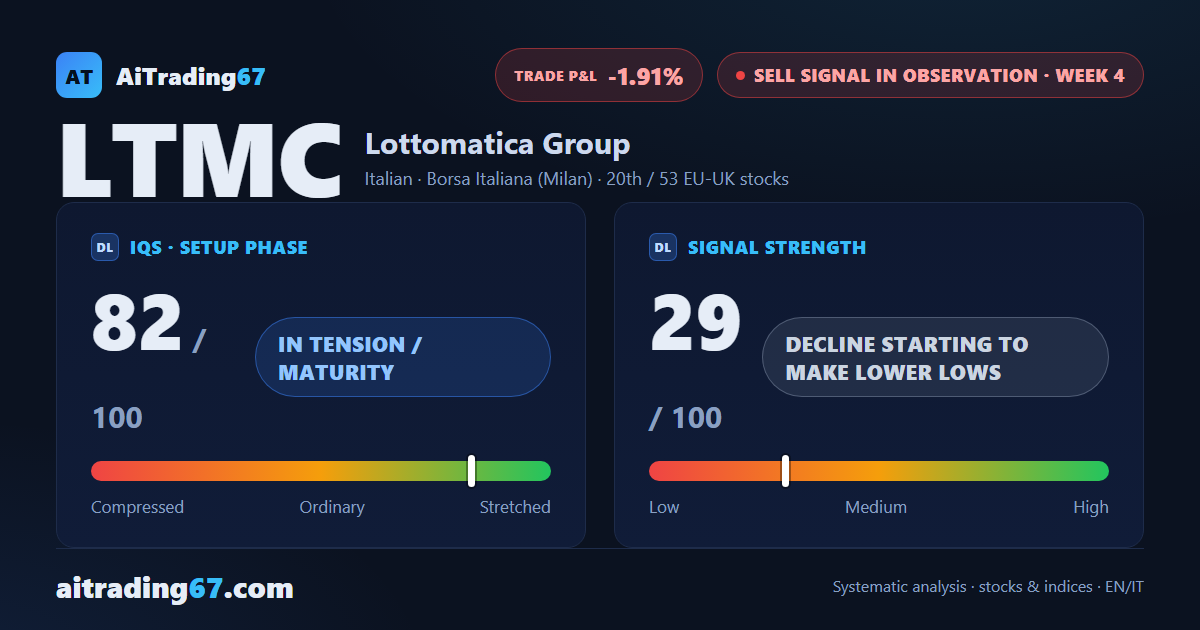
Lottomatica's sell signal is back in motion: after two rebound weeks, the stock drops 2.6% and resumes its lower-lows decline — signal strength climbs to 29 out of 100. Lottomatica is still 49.5% above its 200-week average, with sellers back in control of the tape. In this week's technical analysis the stock climbs to 20th among the 53 European sell signals.
Sell signal in observation
·4th week from start
·EU-UK stocks
·T2
·📅 Earnings · Jul 29
★ See Gold version →
IQS Phase
82
in tension / maturity
Signal Strength
29
decline starting to make lower lows
Sizing
MINIMUM
Ranking
#20 / 53
EU-UK stocks sell signals
Trade P&L %
-1.91%
from signal to today
restricted Platinum content