
Sell signal, week 3: the decline finds its stride
Mastercard slips 2.7% to a fresh 30-day low as the 20-week average holds
Our view last week
On the daily chart Mastercard stock keeps printing lower highs, from the 593 area down to the 571 area, and the week's small 0.4% gain stalls right under the 20-day moving average. In the weekly bar buyers took over again after 3 weeks of sellers, yet the price action stays bearish. The sell signal is in week 2, with strength stuck at 3 out of 100: a decline losing steam. Among US stocks it is one to watch from the sidelines: technical analysis says wait.
This week's summary
Mastercard lost 2.7% and printed a fresh 30-day low during the week, in the 545 area, before closing just above its 20-week moving average. A week ago the decline had no push, with signal strength at 3 out of 100: now it has picked up pace. On technical analysis Mastercard stock stays in a Sell signal, with bearish price action and lower highs on the daily chart. Among US stocks it is one to follow closely, and our model sees opening new positions here as high-risk.
Sell signal in observation
·3rd week from start
·US stocks
·T2
·📅 Earnings · Oct 22
★ See Gold version →
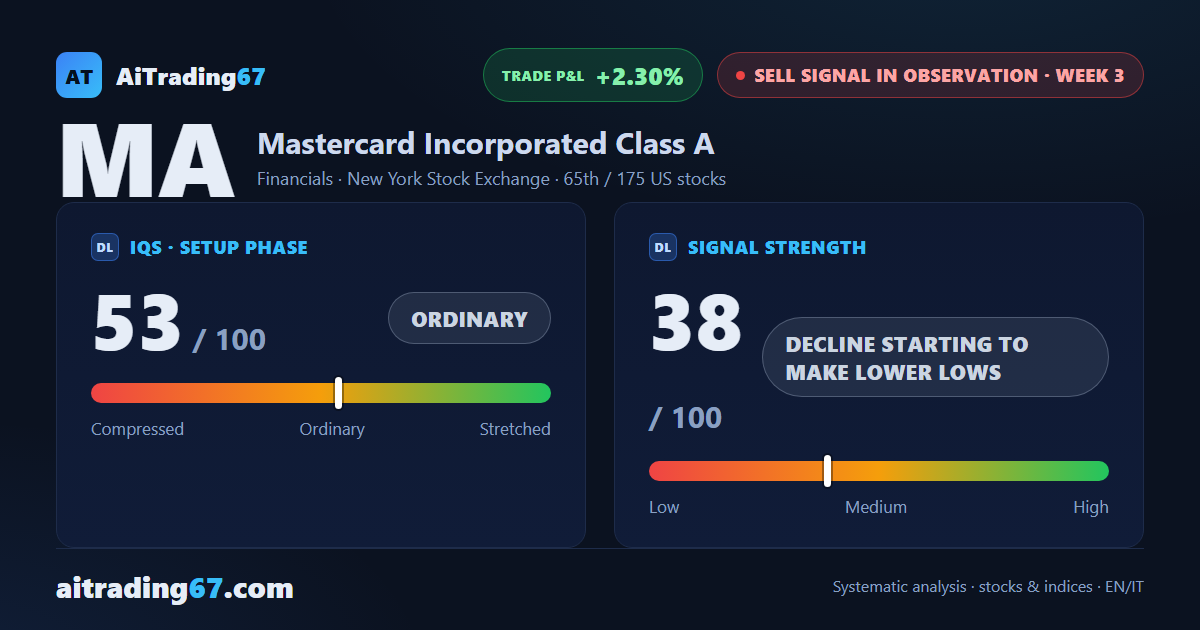
IQS Phase
53
ordinary
Signal Strength
38
decline starting to make lower lows
Sizing
REDUCED
Ranking
#65 / 175
US stocks sell signals
Trade P&L %
+2.30%
from signal to date, no stop loss
Mastercard (MA) weekly chart — EMA50 · MACD · VWAP
Weekly chart · EMA50 · MACD · VWAP · Source: TradingView
Rank position
ranks 65th among the 175 sell signals for US stocks in our ranking, with a signal strength of 38 out of 100.
Sector context
SectorFinancials
Benchmark ETFXLF
Sector regimeweak phase
Performanceweekly -2.46% · monthly -7.23%
MA belongs to the financials sector (reference ETF XLF). The sector is classified weak phase according to our weekly reading.
restricted Platinum content