
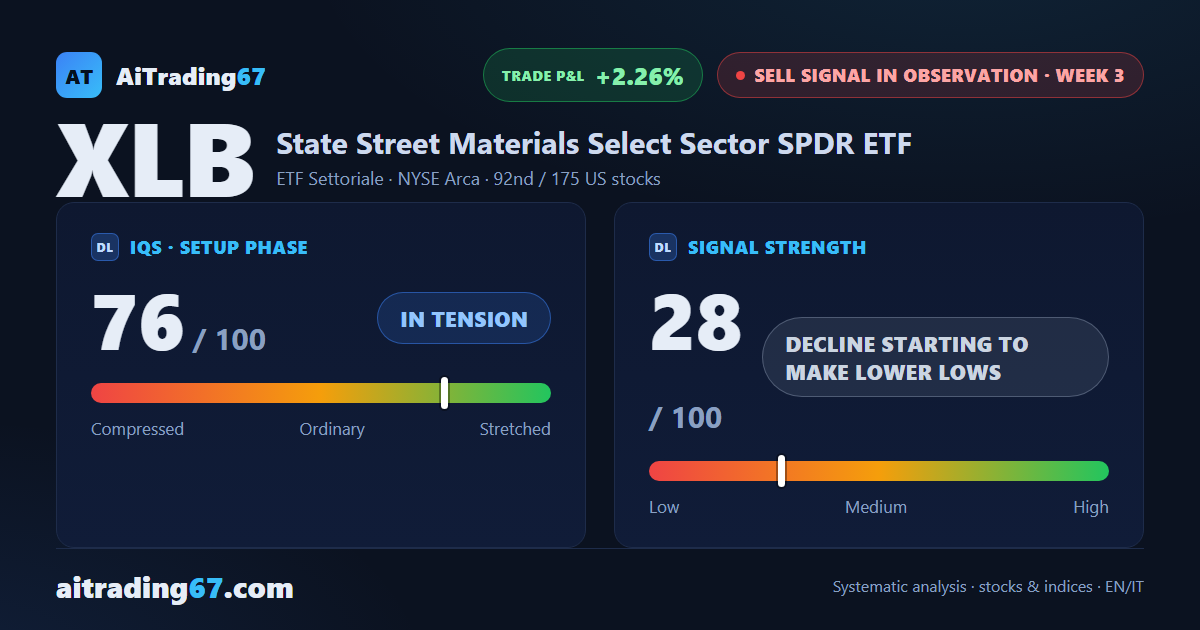
Sell signal in observation · week 3 · NYSE Arca
XLB drops 1.9% and loses its 50-week average in a 6th straight weekly decline
Our view last week
After 5 straight down weeks, XLB, the US materials sector ETF, is slowing: the week closes at -0.4% and price is leaning on its 50-week average, in the 49.7 area. On the technical analysis side, the sell signal has lost steam since last week, while the price action still sides with the sellers, with 4 lower highs on the daily chart. For swing trading, the signal's second week is still open, and the quality band flags trading as not recommended.
This week's summary
XLB, the US materials sector ETF, has lost its 50-week moving average: the week closes down 1.9%, the 6th straight decline, after a fresh 90-day low in the 47.8 area. A week ago price was still leaning on that average and the sell signal had lost steam; now, on the technical analysis side, the decline has picked up pace, with weak price action and negative money flow. For swing trading the quality band still flags trading as not recommended: supports are close.
IQS Phase
76
in tension
Signal Strength
28
decline starting to make lower lows
Sizing
MINIMUM
Ranking
#92 / 175
US stocks sell signals
Trade P&L %
+2.26%
from signal to date, no stop loss
Materials US (XLB) weekly chart — EMA50 · MACD · VWAP
Weekly chart · EMA50 · MACD · VWAP · Source: TradingView
Rank position
ranks 92nd among the 175 sell signals for US stocks in our ranking, with a signal strength of 28 out of 100.
Sector context
SectorETF Settoriale
Benchmark ETFXLB
Sector regimeweak phase
Performanceweekly -1.89% · monthly -7.72%
XLB belongs to the etf settoriale sector (reference ETF XLB). The sector is classified weak phase according to our weekly reading.
restricted Platinum content