
LVMH stuck between support and resistance
LVMH slips 1.2% and stays boxed under resistance after its bounce off the lows
LVMH stuck between support and resistance
Our view last week
LVMH is in week 3 of a buy signal, but the confirmation week closed bearish and our model flags an exit from the position. The dynamic stop has already tightened to -3.61% from entry, more protective than the structural level in the 471.5 area. The stock ranks 56th among the 62 European stock buys currently open, with earnings coming in three to four weeks, on July 28.
This week's summary
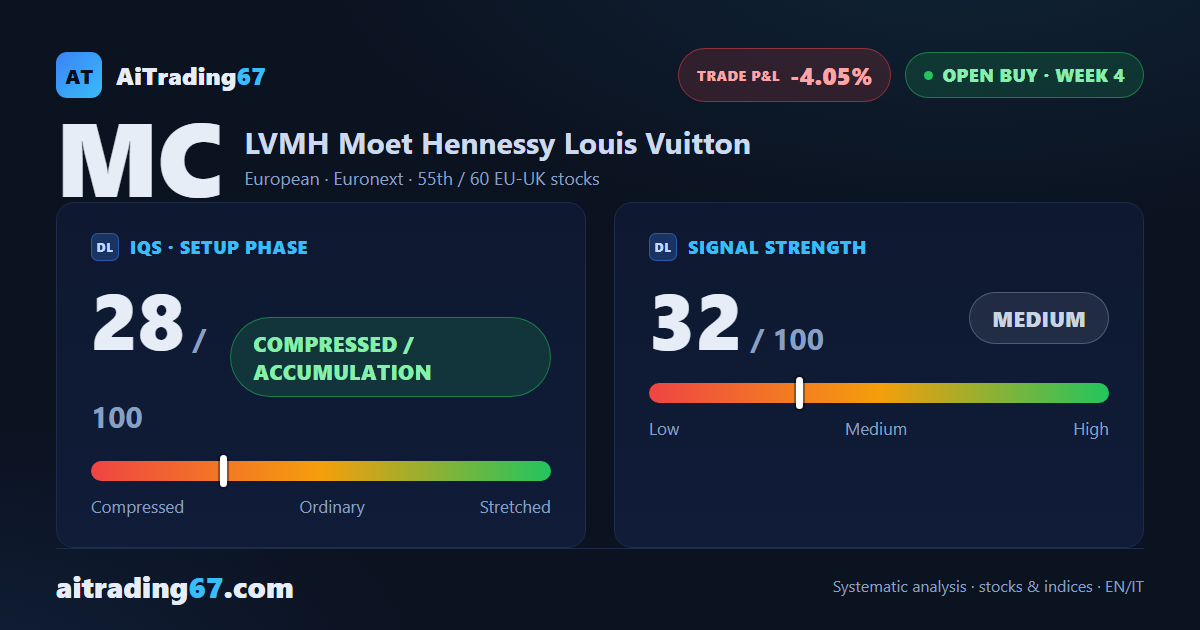
LVMH shares slip 1.2% this week: after last week's confirmation-week call to exit, the focus shifts to the levels. The stock stays boxed under a wall of resistance, following a 17% bounce off a double bottom in the 466 area. The weekly technical picture shows fading conviction — ADX turning down, MACD deteriorating — while sellers edge back in control on the short-term charts. The Buy signal is in its 4th week, running a modest loss.
IQS Phase
28
compressed / accumulation
Signal Strength
32
medium · weak
Sizing
REDUCED
Ranking
#55 / 60
EU-UK stocks in progress
Trade P&L %
-4.05%
from signal to today
restricted Platinum content