
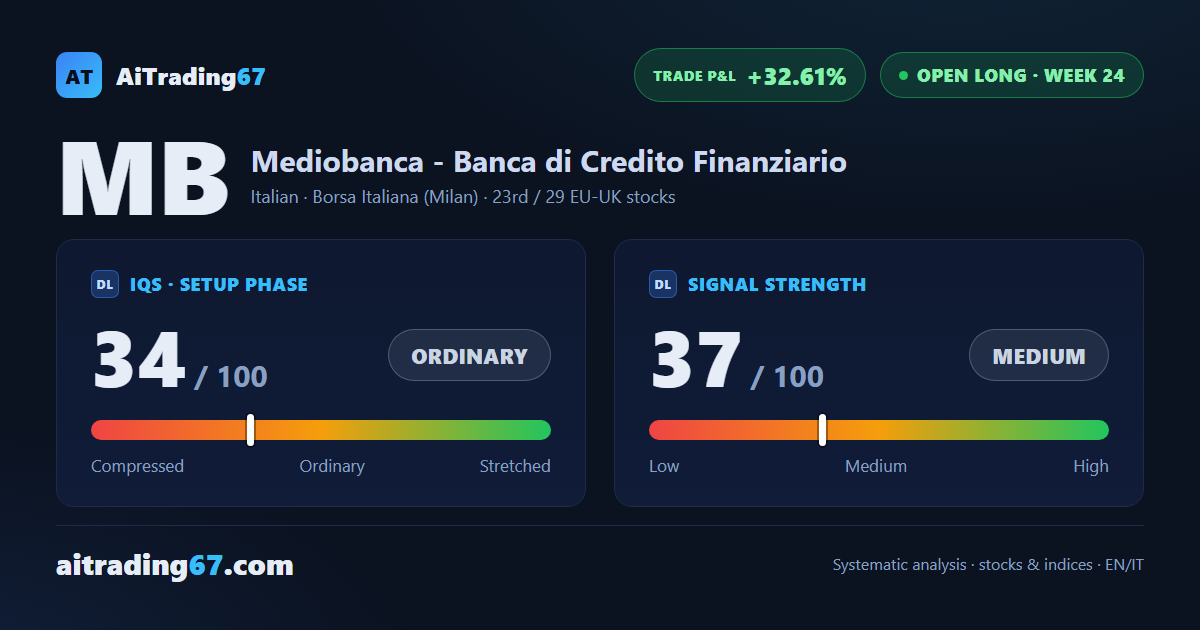
Open long · week 24
Mediobanca drops 5.6% and slips below its Inversion Point with no change of sign
Our view last week
Mediobanca is moving again after last week's stall: the week closes up 2% with 90% of volume on the buy side, and money flow rises to its highest level in 4 weeks. The Mediobanca stock technical analysis still shows one knot: the weekly MACD sits below its Signal line for a second week, while price trades less than 0.5% below its all-time high. In price action trading terms, the buy signal is still live, with the trade 40.5% up since entry.
This week's summary
A week after brushing its all-time high, Mediobanca drops 5.6% and falls back below its 50-day moving average, with a new 30-day low left unconfirmed at the close. In this Mediobanca stock technical analysis the price action is weakening: weekly RSI from 71 to 60, MACD below its Signal line for a 3rd week, contracting volumes. It stays among our weekly buy signals. Price closed below the first stop level (SL1) flagged in last week's card (27.51 area): for anyone following that level the trade is closed. The close and the Inversion Point, in the 28 area, have already crossed with no change of sign declared: one to watch in the coming sessions.
IQS Phase
34
ordinary
Signal Strength
37
medium · weak
Sizing
REDUCED
Ranking
#23 / 29
EU-UK stocks in progress
Trade P&L %
+32.61%
from signal to date, no stop loss
Mediobanca (MB) weekly chart — EMA50 · MACD · VWAP
Weekly chart · EMA50 · MACD · VWAP · Source: TradingView
Rank position
ranks 23rd among the 29 Longs already running for European-UK stocks in our ranking, with a signal strength of 37 out of 100.
Sector context
SectorItalian
Benchmark ETFEXV1
Sector regimeweak phase
Performanceweekly -4.91% · monthly -4.92%
MB belongs to the italian sector (reference ETF EXV1). The sector is classified weak phase according to our weekly reading.
restricted Platinum content