FTSE MIB · buy at week 10
FTSE MIB hugging its record high: bullish signal at week 10, up 13% since entry
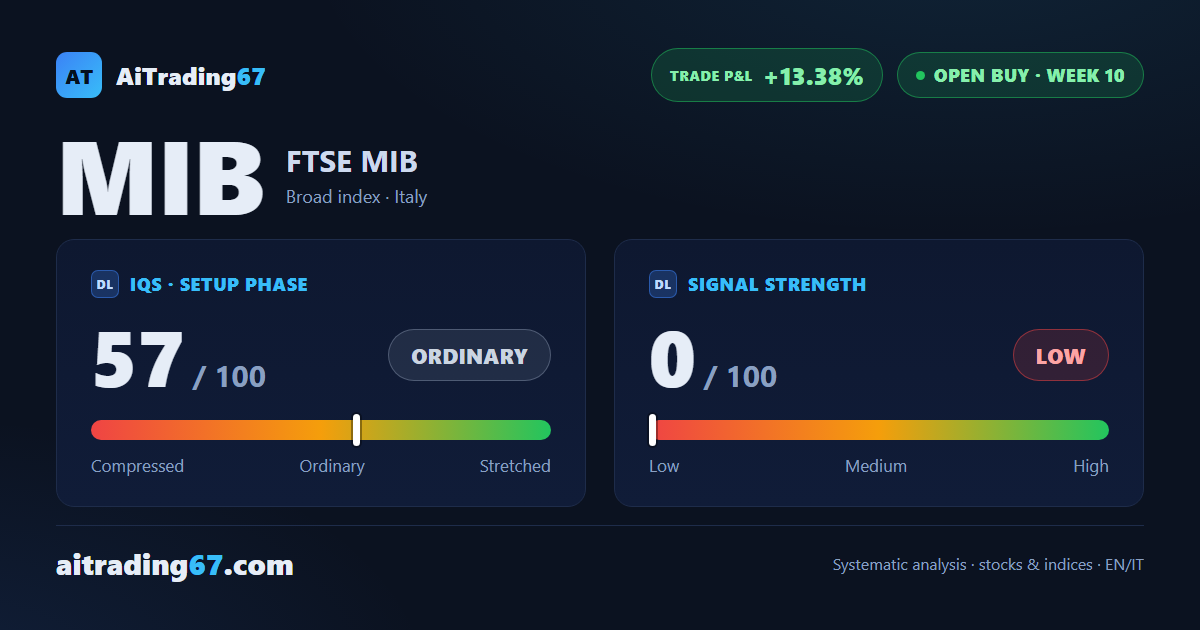
FTSE MIB · buy at week 10
In Summary
The FTSE MIB is trading less than a percentage point from its record high, with the bullish signal in its 10th week and a 13% gain since entry. The weekly structure is full — four aligned moving averages, price above the Ichimoku cloud — but Signal Strength is low and fading, and the first of the three statistical profit-taking areas has already been cleared. A mature picture, not a reversal, to be managed with discipline.
IQS Phase
57
ordinary
Signal Strength
0
low · fading
ATH distance
0.61%
0.61%
KPI 4
0/3
Trade P&L %
+13.38%
from signal to today
restricted Platinum content