
EN IT

FTSE MIB hugging its highs: the rally holds but momentum is fading

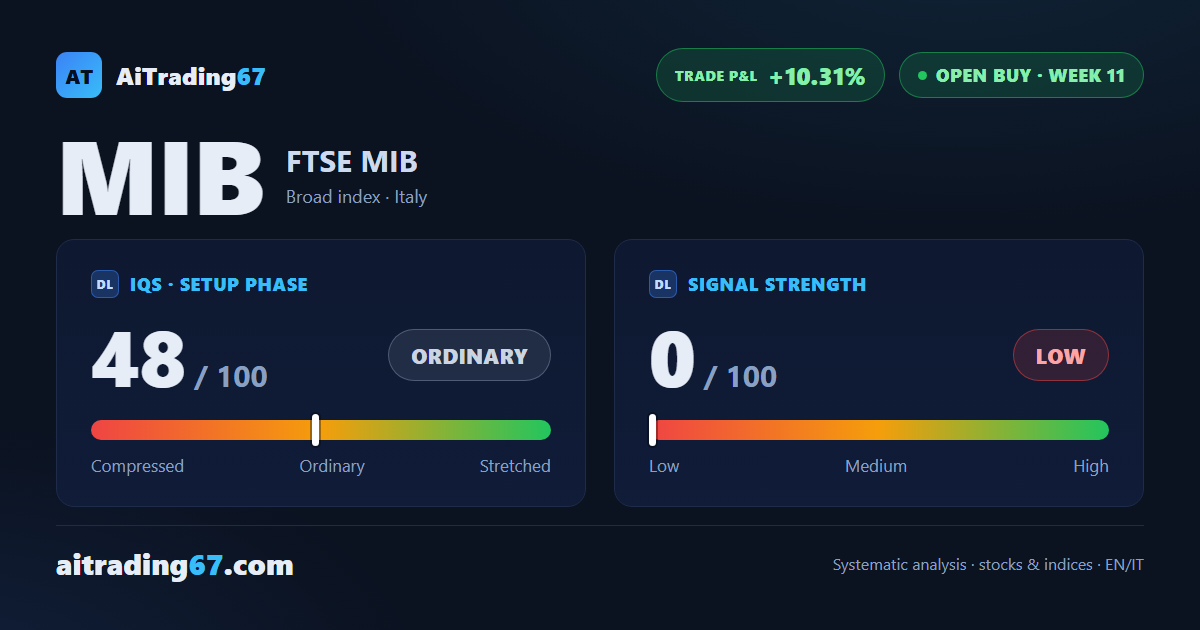
FTSE MIB weekly technical analysis: the buy setup is in its 11th week, +10.31% performance and hugging the all-time high. Full weekly structure, but Signal Strength drops to 0 of 100 and two of three trim windows have passed — a mature trade setup to manage, not to add to.

FTSE MIB hugging its highs: the rally holds but momentum is fading
FTSE MIB · 11th week of a buy, +10.31%
FTSE MIB hugging its highs: the rally holds but momentum is fading
June 26, 2026
FTSE MIB · 11th week of a buy, +10.31%
In Summary
The FTSE MIB is in the 11th week of a weekly buy signal, running at +10.31% from entry and a whisker below its all-time high. The technical structure remains full across all timeframes, yet Signal Strength has slipped to 0 of 100 and two of the three statistical trim windows are already behind it. A mature picture, to be managed with care rather than reinforced.
Open BUY ·11th week from start ·EU-UK Broad indices ·T1 ★ See Gold version →
IQS Phase
48
ordinary
Signal Strength
0
low · fading
ATH distance
3.41%
3.41%
KPI 4
0/3
Trade P&L %
+10.31%
from signal to today
Chart · Weekly — EMA50 · MACD · VWAP
Weekly chart · EMA50 · MACD · VWAP · Source: TradingView
How to read this pageA visual guide to the post, card by card
The full analysis, operating plan and detailed levels on this asset are reserved for clients★ PLATINUM
restricted Platinum content
Share WhatsApp Telegram Gmail LinkedIn