
Buy signal running, pinned to the record
MIB (FTSE MIB): at the record for 15 weeks, but the drive is spent
Buy signal running, pinned to the record
Our view last week
The MIB, an ETF tracking the FTSE MIB, is backing off its all-time high after weeks glued to the record: the buy signal's gain eases to +11.51% and the latest weekly candle shows sellers taking control. The underlying structure holds, but our weekly technical read points to a spent cycle — Signal Strength is at 0 out of 100 and the model's scenario leans to the exit. For anyone already in, this is the phase where you protect the profit banked.
This week's summary
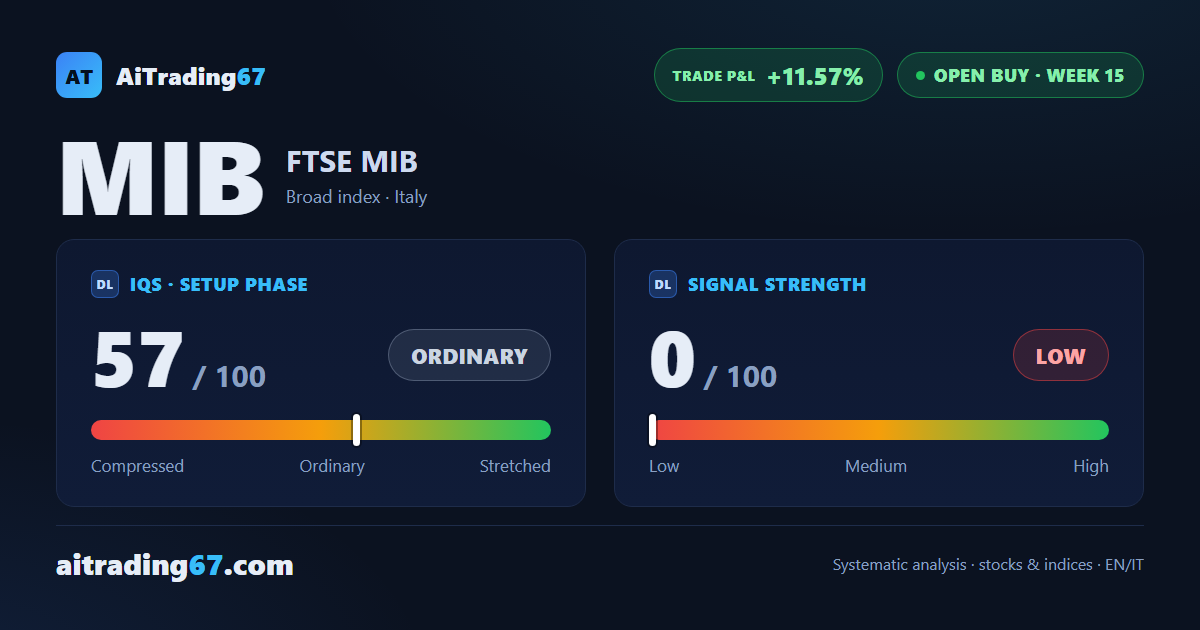
The MIB, the ETF tracking the FTSE MIB, stays pinned to its all-time high in the 15th week of a buy signal, up 11.57%. On the daily, price action prints a double bottom in the 52 area and buyers dominate the tape, yet the weekly picture looks spent: the MACD histogram has fallen for a month and Signal Strength is at 0 out of 100. The confirmation week closed higher, but our model reads an uptrend now late in its cycle.
IQS Phase
57
ordinary
Signal Strength
0
low · fading
ATH distance
2.55%
2.55%
KPI 4
0/3
Trade P&L %
+11.57%
from signal to today
restricted Platinum content