
FTSE MIB · week 17 of a buy signal
MIB ETF (FTSE MIB): back on the record high, with RSI stretched
FTSE MIB · week 17 of a buy signal
Our view last week
The MIB, the FTSE MIB ETF, tested its all-time high and was pushed back: the week closed undecided and daily buying fell below 30% of turnover, after weeks of buyers owning the tape. The weekly technical analysis still reads solid — ADX at 33.7 and rising, moving averages aligned — with the trade at +12.37% performance since entry. The drive is thinning, and the moment calls for disciplined risk management.
This week's summary
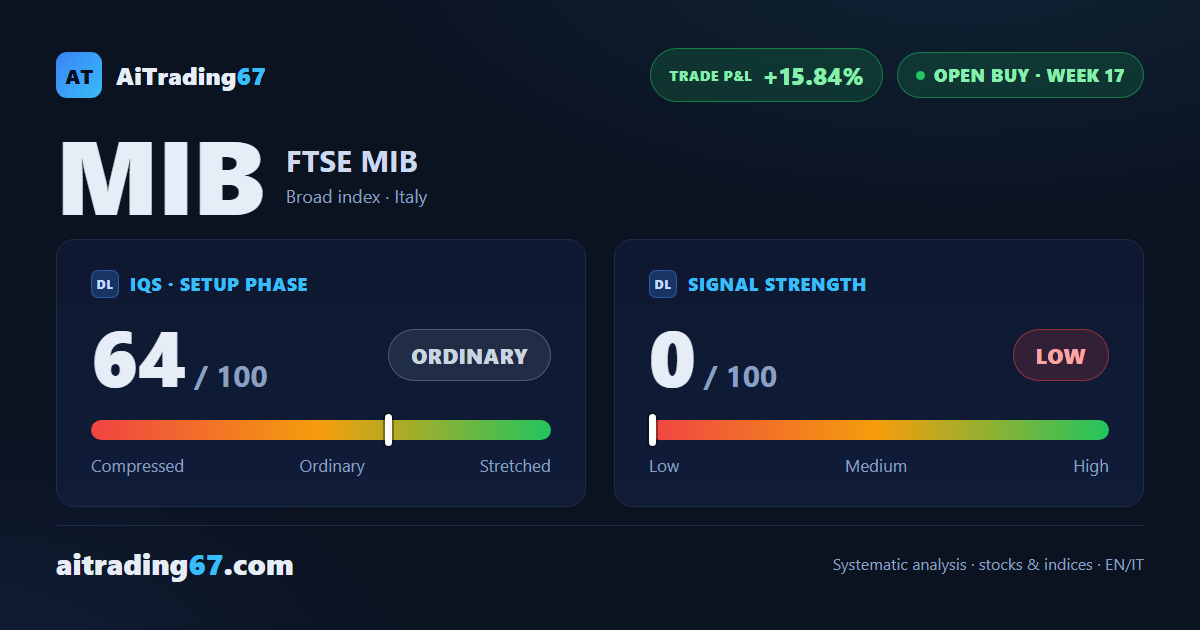
The MIB, the FTSE MIB ETF, shakes off last week's hesitation: it is pressing on the all-time high again, now just 0.53% above, and lifts performance since the buy signal to 15.84%. The weekly technical analysis reads of a trend gaining conviction — ADX at 35 and rising, MACD improving again — with RSI at 71.6 in stretched ground and daily buying participation still below 40%. The cycle enters its most strained stretch.
IQS Phase
64
ordinary
Signal Strength
0
low · fading
ATH distance
0.53%
0.53%
KPI 4
0/3
Trade P&L %
+15.84%
from signal to date, no stop loss
restricted Platinum content