
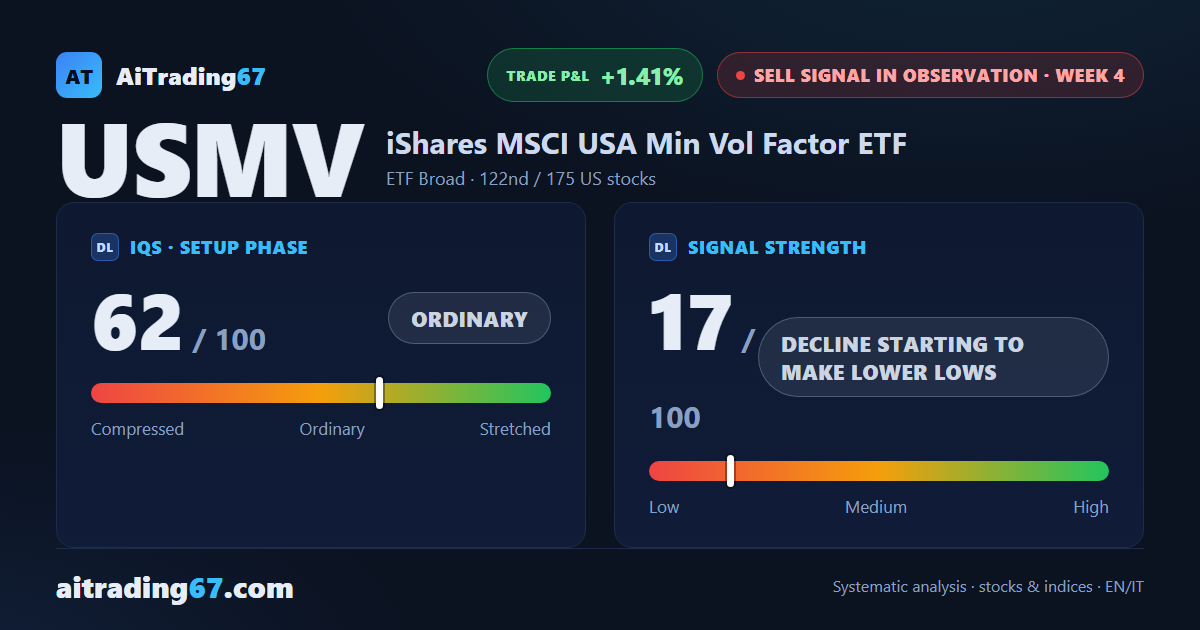
US minimum volatility ETF · sell signal, week 4
USMV slips 0.1%: a fresh 30-day low the weekly close fails to confirm
Our view last week
The weekly MACD on USMV, the US minimum volatility ETF, has dropped below its Signal line for the first time in 18 weeks, while the week closed almost flat, down 0.1%. Sellers still lead the weekly bar, but compared with seven days ago the pressure has gone out of the move. USMV technical analysis finds the price squeezed between the daily Inversion Point, in the 99 area, and its average, in the 98.3 area: for swing trading, this is a wait-and-see phase.
This week's summary
USMV, the US minimum volatility ETF, printed a fresh 30-day low this week, in the 97.3 area, and the weekly close did not confirm it: the week ends down 0.1%. Last week the weekly MACD had just dropped below its Signal line; now USMV technical analysis shows price action giving ground in small steps, a 5th straight weekly decline, with the 20-week average still holding. The sell signal remains unconfirmed: for swing trading, this is a wait-and-see phase.
IQS Phase
62
ordinary
Signal Strength
17
decline starting to make lower lows
Sizing
MINIMUM
Ranking
#122 / 175
US stocks sell signals
Trade P&L %
+1.41%
from signal to date, no stop loss
Min Volatility (USMV) weekly chart — EMA50 · MACD · VWAP
Weekly chart · EMA50 · MACD · VWAP · Source: TradingView
Rank position
ranks 122nd among the 175 sell signals for US stocks in our ranking, with a signal strength of 17 out of 100.
Sector context
SectorETF Broad
Benchmark ETF—
Sector regime
Performanceweekly coming soon · monthly coming soon
USMV belongs to the etf broad sector (reference ETF ).
restricted Platinum content