
Ongoing decline · week 29 · Borsa Italiana (Milan)
Moncler adds 0.3% and the daily averages turn the bounce back once more
Our view last week
After three red weeks Moncler closes with a small gain, +0.7%, and sellers step back: from 88% of volume a week ago to 58%. The bounce stalled against the daily moving averages in the 44.7 area, though, and weekly price action still shows distribution, with money flow negative for 16 weeks. In our technical analysis of Moncler stock the sell signal still stands, a swing trading short now 16.4% in profit.
This week's summary
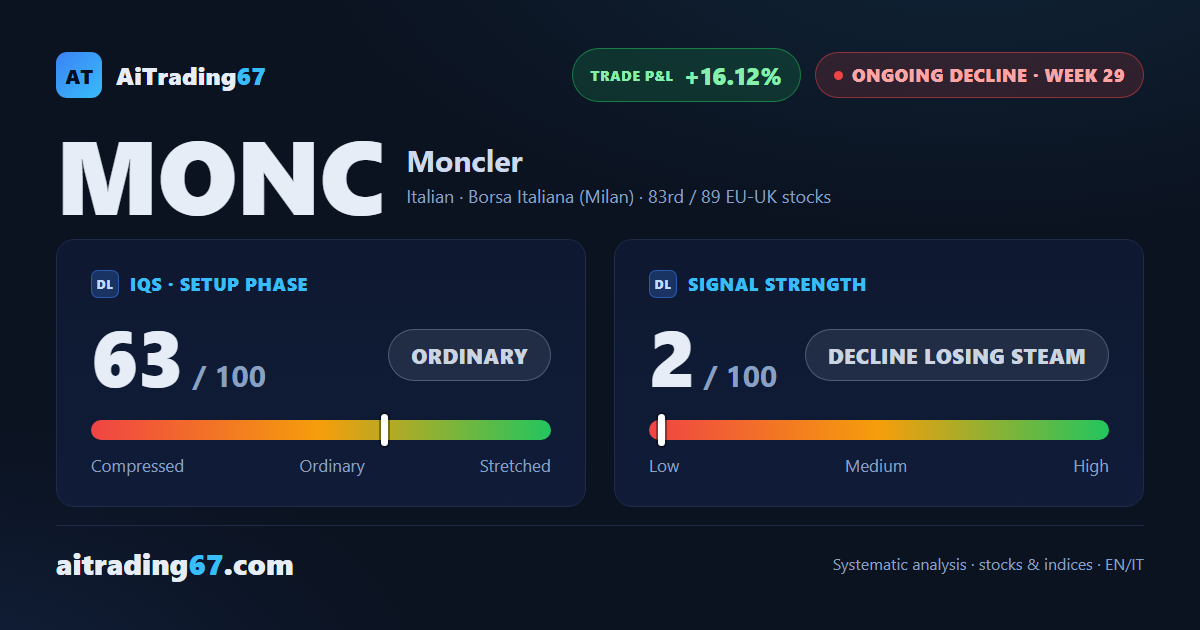
A second straight weekly gain for Moncler, +0.3%, and a second stall at the daily averages: the week closed in the lower part of its range, below the 20-day moving average in the 44.5 area. The MACD histogram is rising and money flow is at its least negative in 4 weeks, yet it has been below zero for 17 and volumes are contracting. In our technical analysis of Moncler stock the sell signal holds, the short 16.1% in profit: one of the Italian stocks to watch for swing trading.
IQS Phase
63
ordinary
Signal Strength
2
decline losing steam
Sizing
MINIMUM
Ranking
#83 / 89
EU-UK stocks
Trade P&L %
+16.12%
from signal to date, no stop loss
Moncler (MONC) weekly chart — EMA50 · MACD · VWAP
Weekly chart · EMA50 · MACD · VWAP · Source: TradingView
Rank position
ranks 83rd among the 89 sell signals for European-UK stocks in our ranking, with a signal strength of 2 out of 100.
Sector context
SectorItalian
Benchmark ETFEXH7
Sector regime
Performanceweekly coming soon · monthly coming soon
MONC belongs to the italian sector (reference ETF EXH7).
restricted Platinum content