
Merck: the double bottom holds, the signal cools
Merck slips 4.6% but its double bottom holds: week 7 of the buy signal
Merck: the double bottom holds, the signal cools
Our view last week
Merck & Co. is in week 6 of a buy signal, with the trade up 5.8% since entry. Signal strength has eased to 35 out of 100, but 2 of the 3 targets from our most advanced model are already hit and the dynamic stop has moved past breakeven. Price is currently sitting between the model's nearest resistance and support.
This week's summary
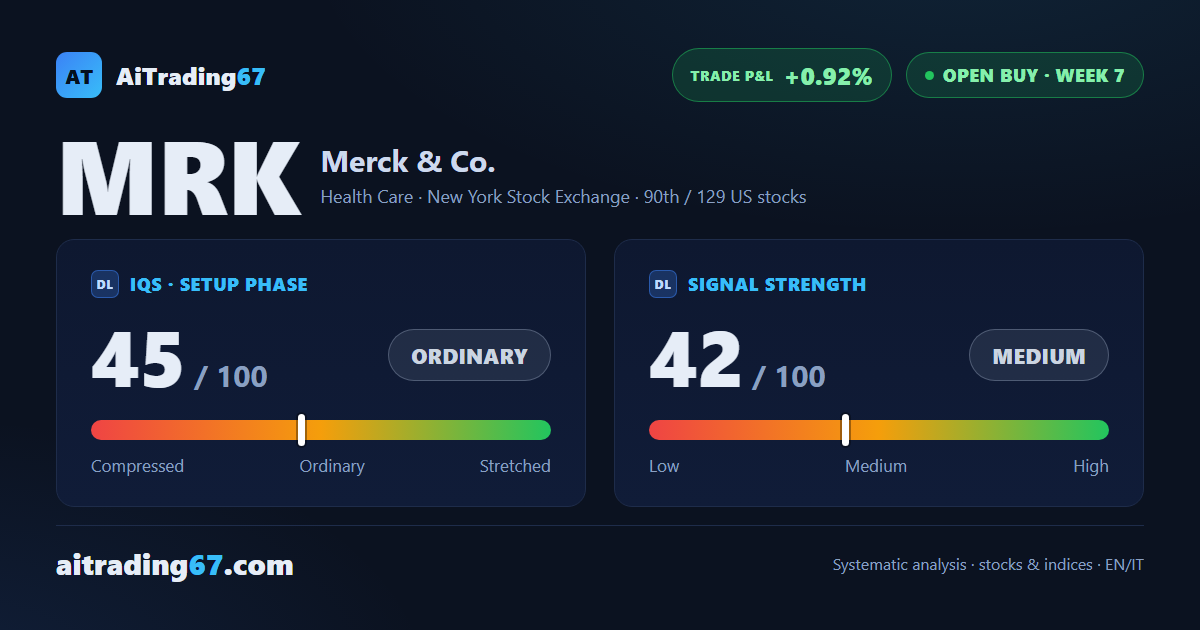
Merck closed the week down 4.6%, with sellers dominant on the last candle and buyers in retreat — but the daily chart tells a different story: a clean double bottom in the 113 area already produced an 11% rebound. The buy signal is in its 7th week, with profit thinned to under 1% after the pullback. The health care sector remains in a strength phase in the background.
IQS Phase
45
ordinary
Signal Strength
42
medium · weak
Sizing
REDUCED
Ranking
#90 / 129
US stocks in progress
Trade P&L %
+0.92%
from signal to today
restricted Platinum content