
Merck bounces 3.2%, 8th week of the buy signal
Merck rebounds 3.2% off its EMA20 and presses back near its all-time highs
Merck bounces 3.2%, 8th week of the buy signal
Our view last week
Merck closed the week down 4.6%, with sellers dominant on the last candle and buyers in retreat — but the daily chart tells a different story: a clean double bottom in the 113 area already produced an 11% rebound. The buy signal is in its 7th week, with profit thinned to under 1% after the pullback. The health care sector remains in a strength phase in the background.
This week's summary
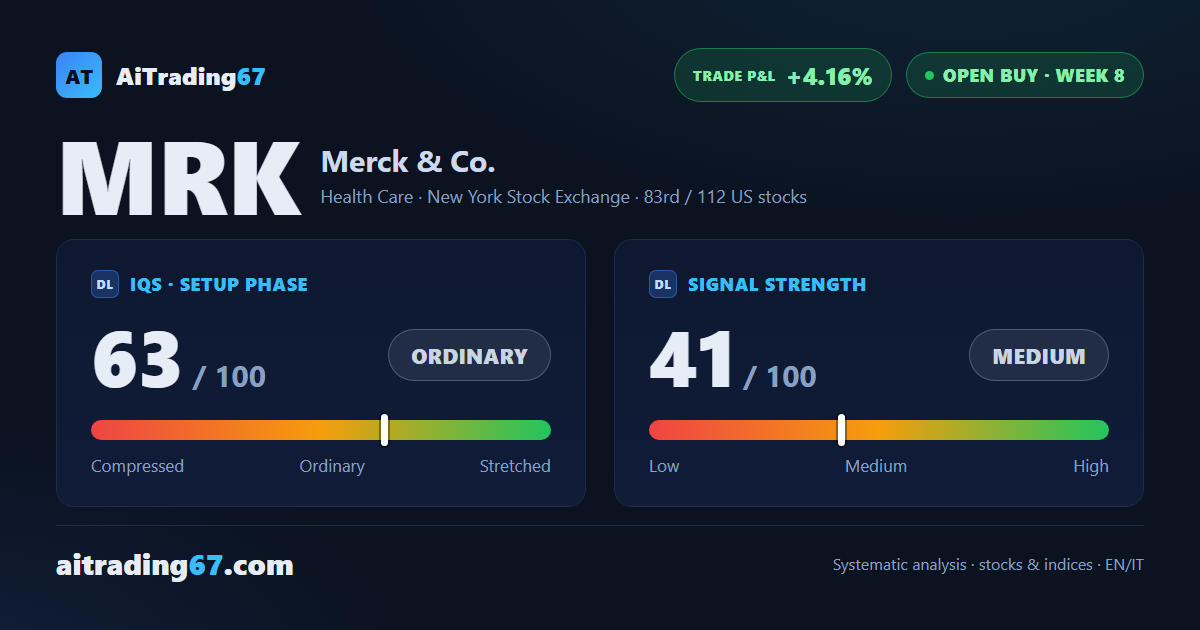
Merck bounces 3.2% off its own 20-day average, with a clean touch in the 123 area followed by a 4% rebound. The weekly technical picture stays constructive - trend intact, health care sector in a strength phase - but the stock is working right up against its all-time highs, already tested three times over the past ten weeks: here discipline calls for a pullback before adding exposure. The buy signal is in its 8th week and the trade's gain climbs to 4.16%.
IQS Phase
63
ordinary
Signal Strength
41
medium · weak
Sizing
REDUCED
Ranking
#83 / 112
US stocks in progress
Trade P&L %
+4.16%
from signal to today
restricted Platinum content