
Moderna: -14.4% in a week, the trend holds
Moderna sheds 14.4% but the Buy signal holds beneath the red candle
Moderna: -14.4% in a week, the trend holds
Our view last week
Moderna is in week 29 of a buy trade that has already completed the model's coverage: all 3 statistical references were hit in the early weeks, and the residual, untrimmed capital now runs at +170.74% since entry. The stop trails the Inversion Point, in the 62.9 area, protecting the accumulated gain. On the technical side, the week just closed shows acceleration, not a slowdown.
This week's summary
After last week's acceleration, Moderna changed gears: the stock shed 14.4% in five days, with 95% of trading on the sell side. Yet beneath the red candle the technical structure holds — MACD still bullish, ADX climbing, momentum at a fresh high for the period. Price now works between support in the 67 area and resistance in the 71 area, with the RSI back from 77 to 63.6: it looks like a technical release inside a trend that's still holding.
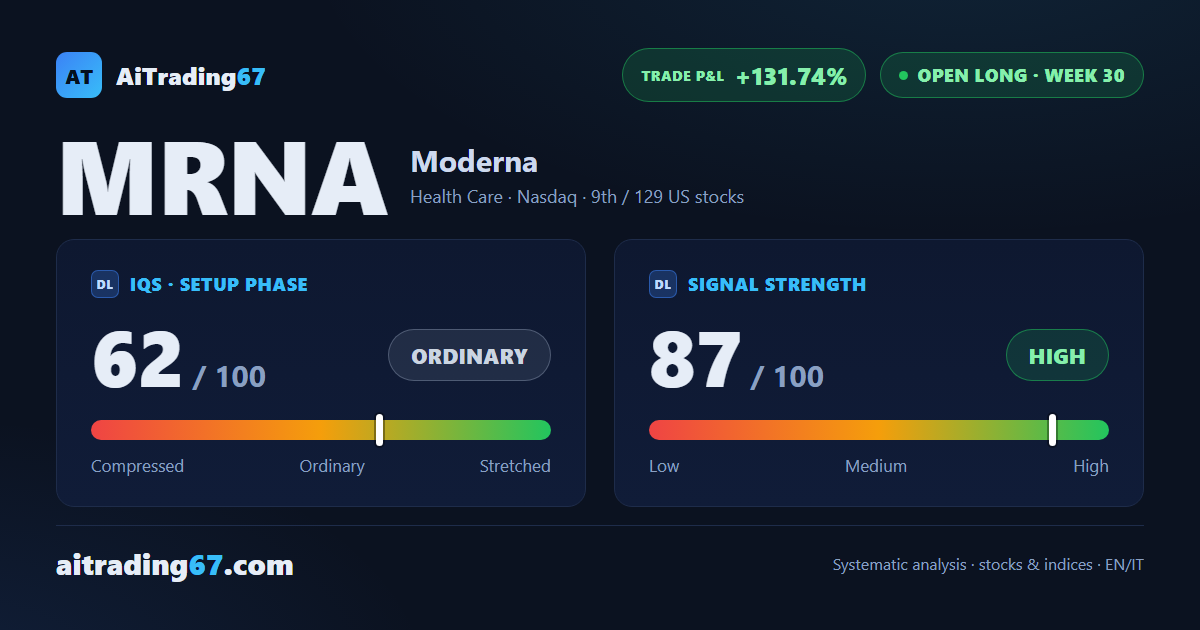
IQS Phase
62
ordinary
Signal Strength
87
high · wide & volatile
Sizing
FULL
Ranking
#9 / 129
US stocks in progress
Trade P&L %
+131.74%
from signal to today
restricted Platinum content