
The sell signal stalls between two technical levels
Microsoft slips 1.4%, boxed in between support and resistance
The sell signal stalls between two technical levels
Our view last week
Microsoft is in week 4 of a sell signal that never confirmed: over the three observation weeks the price kept sliding without confirming the signal, and the week just closed reversed that pattern with a 4.7% rebound. Signal strength drops to 10 out of 100, and the stock ranks 131st among the 137 US sell signals: a decline that holds direction but has lost fresh momentum.
This week's summary
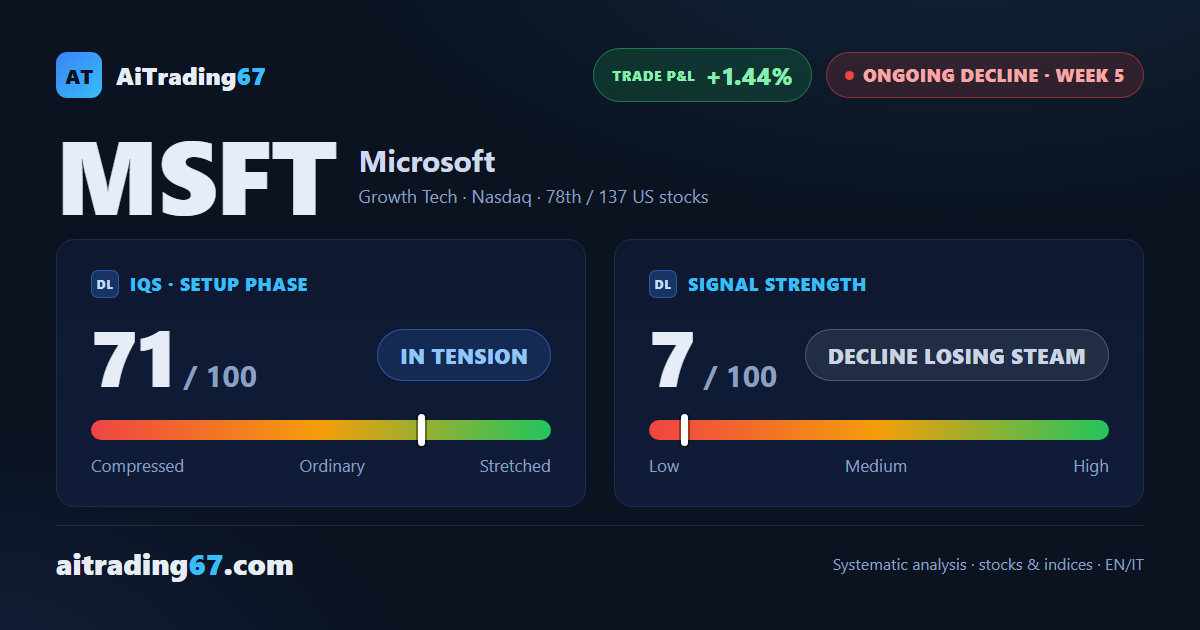
Last week's 4.7% bounce has already faded: this week Microsoft stock slipped 1.4%, and the sell signal, now in its fifth week of management, is back to compressing inside a tight corridor between the 380 area and the 386 area. Under the surface something is shifting: money flow has climbed for a fourth straight reading, even as the weekly MACD just turned into a fresh bearish cross. In this swing trading setup the short is still up 1.44%.
IQS Phase
71
in tension
Signal Strength
7
decline losing steam
Sizing
MINIMUM
Ranking
#78 / 137
US stocks
Trade P&L %
+1.44%
from signal to today
restricted Platinum content