
Strategy Inc, week 6 of a sell signal
Strategy Inc: a 22.4% bounce after the plunge, but the underlying picture stays weak
Strategy Inc, week 6 of a sell signal
In Summary
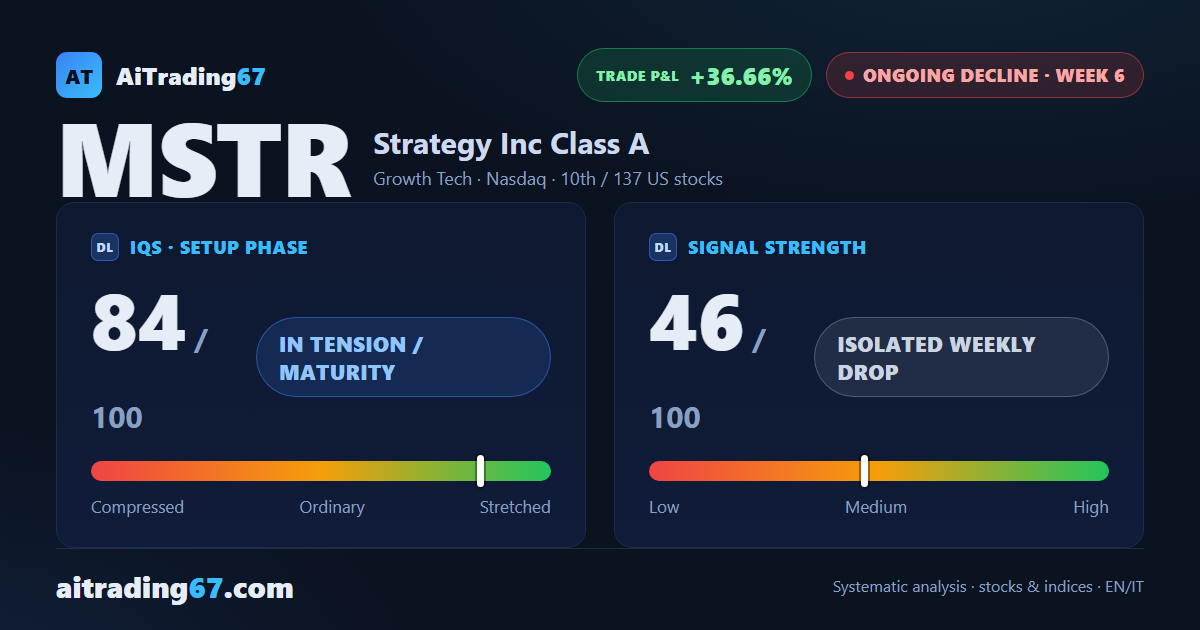
Strategy Inc is in its sixth week of a sell signal, and the week just closed flips the script with a 22.4% bounce, after the prior week's 26.9% plunge. Signal strength drops to 46 out of 100, an isolated weekly drop: not enough to call the decline over, since capital flow stays in distribution and the setup quality indicator still sits at 84 out of 100, deep in tension. The trade holds a 36.66% gain since entry, but opening new positions here stays high-risk per our model.
IQS Phase
84
in tension / maturity
Signal Strength
46
isolated weekly drop
Sizing
REDUCED
Ranking
#10 / 137
US stocks
Trade P&L %
+36.66%
from signal to today
restricted Platinum content