
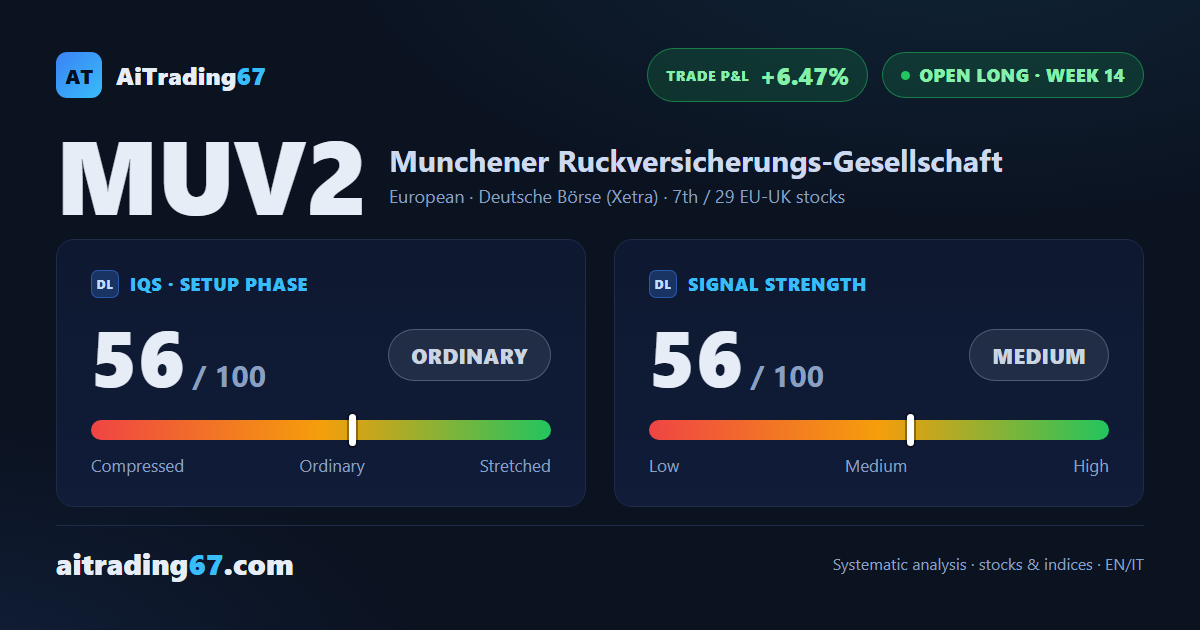
Munich Re · EU-UK stocks · Open long
Munich Re slips 0.4% and recovers from the 492 area as money flow picks up again
Our view last week
Buyers take back the weekly bar: 67% of volume goes to the buy side, after sellers held 79% a week earlier, and Munich Re stock gains 0.9%. The technical analysis still calls for caution: the MACD histogram has been falling for 3 weeks, money flow stays positive but is thinning out, and momentum has dropped below zero. The price action awaits confirmation, with price squeezed between the 510 area and the 511 area.
This week's summary
A slide to the 492 area and back: Munich Re stock ends the week down 0.4%, in the upper part of its range, after a 3% rebound that carried it back to its 20-day moving average. Compared with a week ago, money flow is rising again and momentum is turning up while still negative, and the MACD histogram falls for a 4th week. The technical analysis shows indecisive price action, with contracting volumes and the ADX below 12.
IQS Phase
56
ordinary
Signal Strength
56
medium
Sizing
STANDARD
Ranking
#7 / 29
EU-UK stocks in progress
Trade P&L %
+6.47%
from signal to date, no stop loss
Munich Re (MUV2) weekly chart — EMA50 · MACD · VWAP
Weekly chart · EMA50 · MACD · VWAP · Source: TradingView
Rank position
ranks 7th among the 29 Longs already running for European-UK stocks in our ranking, with a signal strength of 56 out of 100.
Sector context
SectorEuropean
Benchmark ETFEXV1
Sector regimeweak phase
Performanceweekly -4.91% · monthly -4.92%
MUV2 belongs to the european sector (reference ETF EXV1). The sector is classified weak phase according to our weekly reading.
restricted Platinum content