
New sell signal, but strength is already at rock bottom
Nebius Group rises 1.9% and the fresh Sell signal starts off weak
New sell signal, but strength is already at rock bottom
Our view last week
Nebius Group N.V. Class A is in week 16 of a buy signal and sits at +90.90% since entry. All 3 targets of our most advanced model have been hit: coverage is complete and the stop now trails the Inversion Point, in the 220.9 area, protecting the gain built up so far. Earnings are approaching, on July 29.
This week's summary
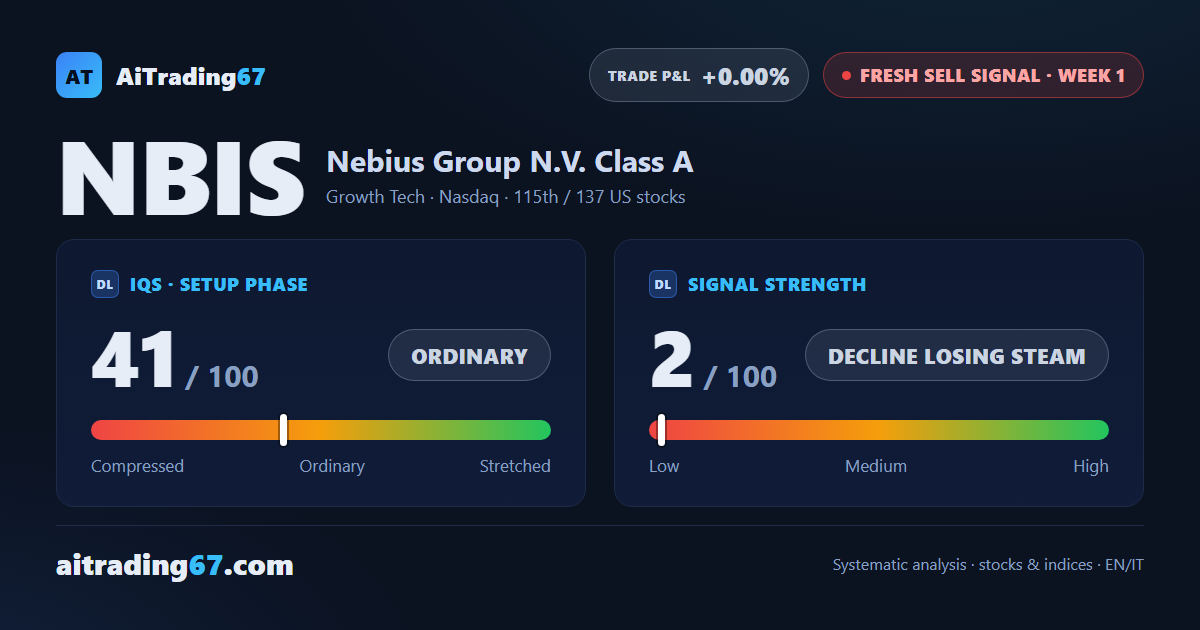
Nebius stock opens a new Sell signal, but the weekly technical analysis tells a mixed story: the week closed up 1.9%, backed by a clean double bottom in the 196 area with a 56% rebound. Signal strength sits at just 2 out of 100 — a decline losing steam — and the quality band flags trading as not recommended. Just a week ago the old buy trade was running at +90% after 16 weeks, with the stop sitting right in this area: the picture has flipped.
IQS Phase
41
ordinary
Signal Strength
2
decline losing steam
Sizing
MINIMUM
Ranking
#115 / 137
New us stocks
Trade P&L %
+0.00%
from signal to today
restricted Platinum content