
A technical bounce inside an active sell signal
Nebius climbs 5.7%, but sellers still control the tape
A technical bounce inside an active sell signal
Our view last week
Nebius shares close the sell signal's confirmation week down 19.1%, after carving a clean double bottom in the 190 area and a 23% rebound. It's the second week of a decline that, per our weekly technical analysis, keeps its pace with lower lows - signal strength at 61. Price sits boxed between the daily Kumo and the pivot average, with earnings two weeks out. Trading not recommended per our model.
This week's summary
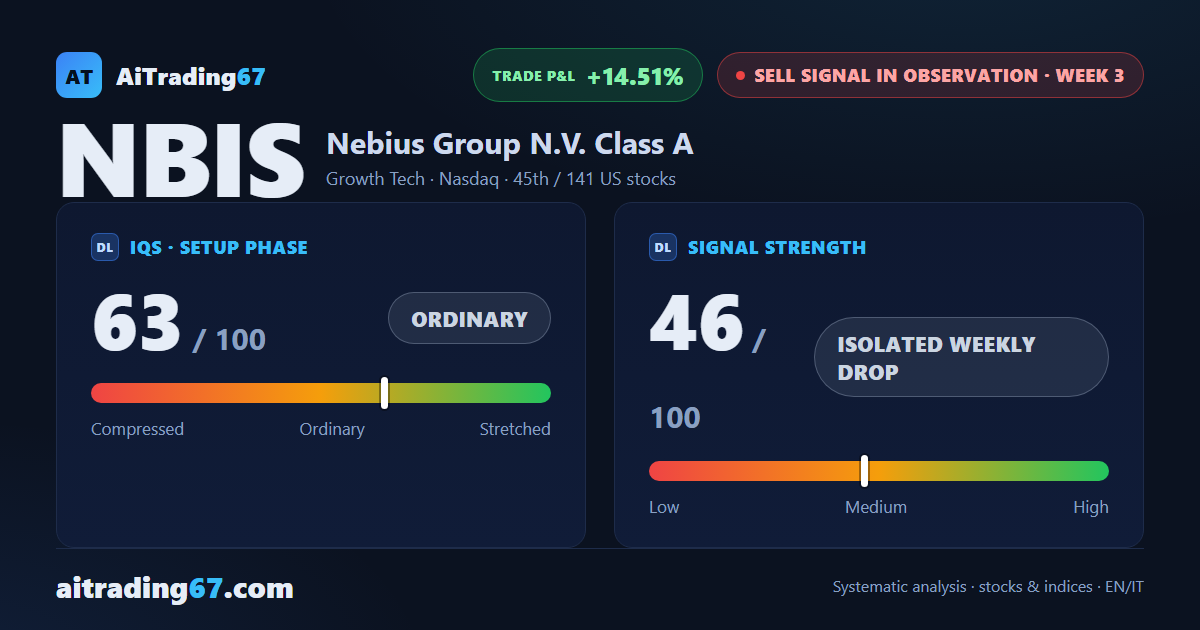
Nebius bounces 5.7% after carving a clean double bottom in the 187 area, with an intermediate rebound of 24% off the lows. The rally doesn't fully convince though: sellers stay firmly in control of the last bar, and daily cash flow remains in distribution. Last week the sell signal already confirmed itself with a 19.1% drop; now price is only attempting a technical bounce, with earnings due this very week, on July 29.
Sell signal in observation
·3rd week from start
·US stocks
·T2
·📅 Earnings · Jul 29
★ See Gold version →
IQS Phase
63
ordinary
Signal Strength
46
isolated weekly drop
Sizing
REDUCED
Ranking
#45 / 141
US stocks sell signals
Trade P&L %
+14.51%
from signal to today
Rank position
ranks 45th among the 141 sell signals for US stocks in our ranking, with a signal strength of 46 out of 100.
Sector context
SectorGrowth Tech
Benchmark ETFXLK
Sector regimeweak phase
Performanceweekly +0.17% · monthly -3.92%
NBIS belongs to the growth tech sector (reference ETF XLK). The sector is classified weak phase according to our weekly reading.
restricted Platinum content