
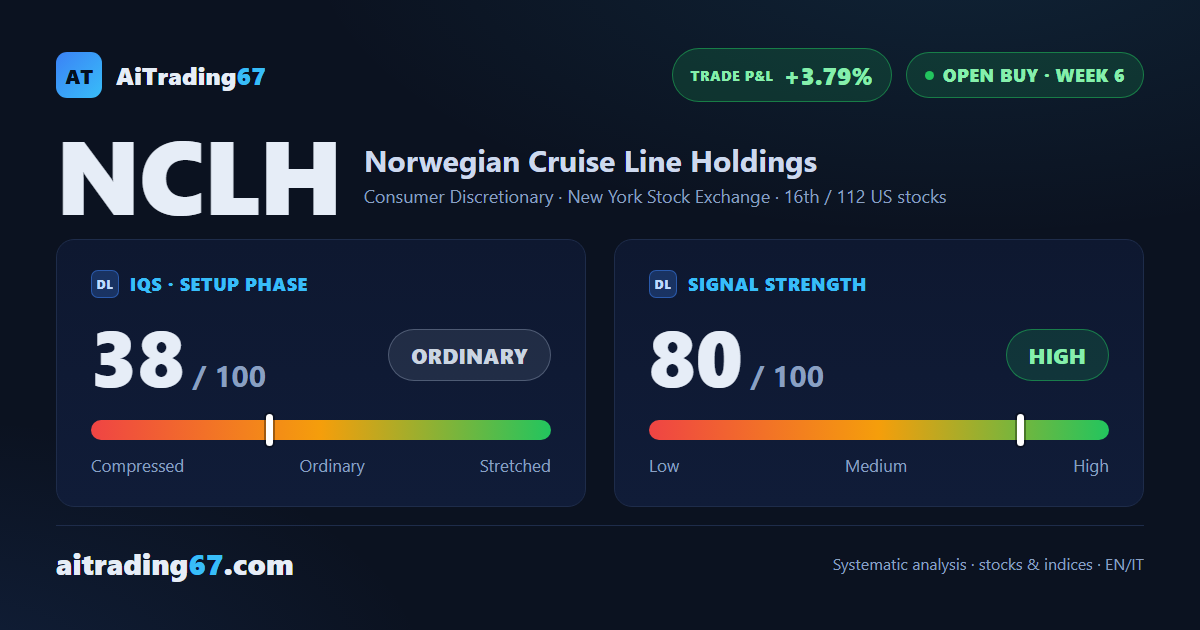
Norwegian Cruise Line, 6th week of the buy trade
Norwegian Cruise Line slips 0.8%, still squeezed between two averages
Norwegian Cruise Line, 6th week of the buy trade
Our view last week
Norwegian Cruise Line barely moved this week (-0.9%), and the technical picture is tightening: price is boxed between the first resistance, the daily pivot average, in the 19.7 area, and the first support, the 100-day average, in the 19.6 area. Buyer dominance is fading and the last bar closed indecisive. The trade is still up 4.59%, with the stop already at breakeven.
This week's summary
Norwegian Cruise Line stock stays boxed in a tight band, between the 19.6 area and the 19.4 area, with buyers losing steam and the last bar closing indecisive. The weekly technical analysis still confirms the buy signal: the stock shed 0.8% this week, the 6th week opened the model's first trimming window, and the trade remains up 3.79%, with the stop already moved to breakeven.
IQS Phase
38
ordinary
Signal Strength
80
high · wide & volatile
Sizing
FULL
Ranking
#16 / 112
US stocks in progress
Trade P&L %
+3.79%
from signal to today
restricted Platinum content