Newmont Corporation — Fresh sell signal
Newmont: weekly model turns bearish, but opening short is high-risk
Newmont Corporation — Fresh sell signal
In Summary
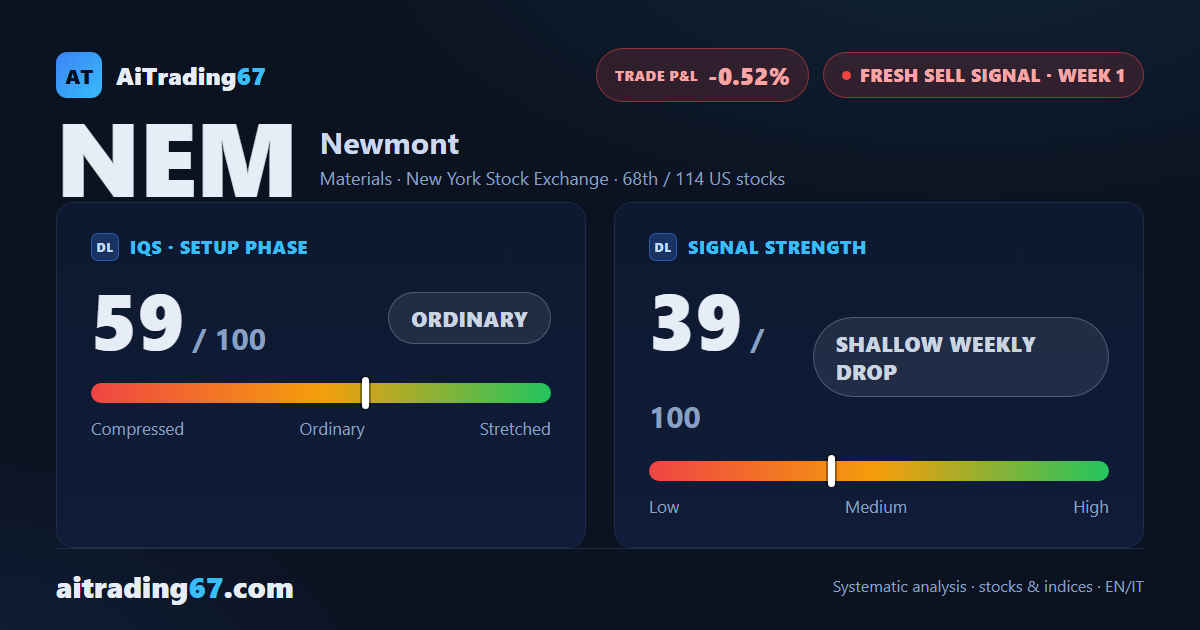
Newmont Corporation receives a fresh weekly sell signal, now in week 1 of observation. Weekly structure is intermediate bearish, quality-of-setup indicator at 59 out of 100 in ordinary phase. Signal strength at 39 out of 100 describes an indecisive week — a shallow drop — not a weakness in the overall picture. The quality band flags trading as not recommended: the confirmation week is still in progress, outcome yet to be defined.
IQS Phase
59
ordinary
Signal Strength
39
shallow weekly drop
Sizing
REDUCED
Ranking
#68 / 114
New us stocks
Trade P&L %
-0.52%
from signal to today
restricted Platinum content