
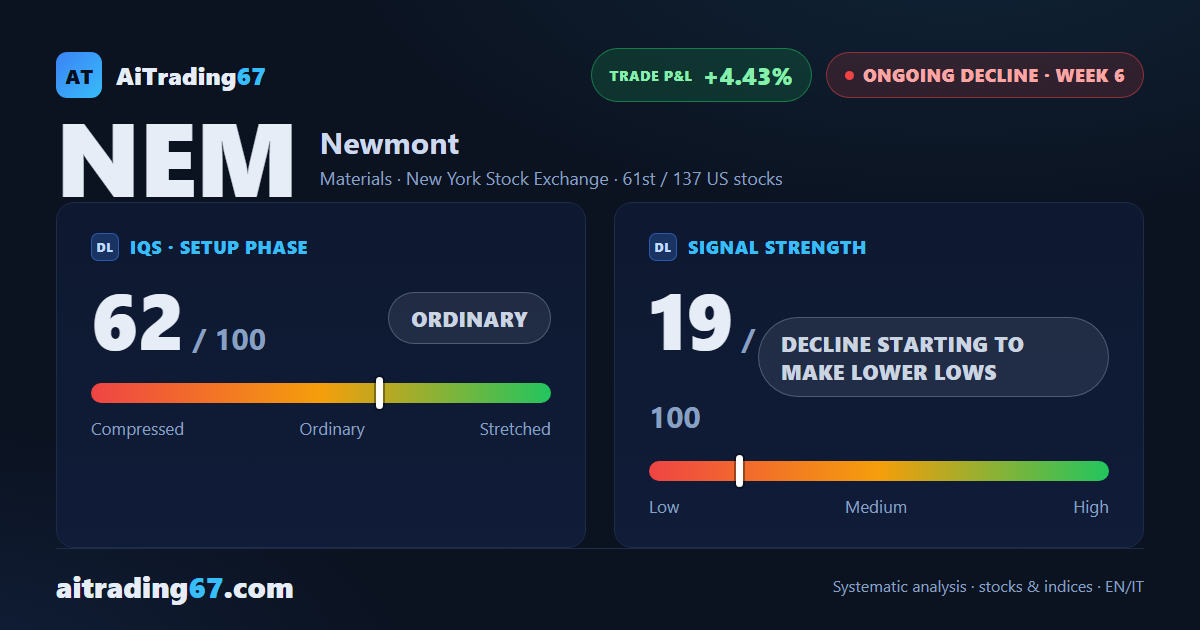
Newmont: double bottom near 91, trend losing steam
Newmont dips 1.8%, yet the double bottom near 91 keeps buyers in the game
Newmont: double bottom near 91, trend losing steam
Our view last week
Newmont is in week 5 of a sell signal, and the picture from recent weeks has turned more nuanced. A double bottom has emerged on the daily chart in the 92 area, with an intermediate 22% rebound, but the weekly price action stays mixed: conflicting rejection candles and a distribution phase still underway. Short-term momentum stays negative, and the direction still needs confirming.
This week's summary
Newmont formed a clean daily double bottom in the 91 area, with an 8% intermediate rebound, but the weekly technical picture stays neutral: volume contracting and two rejection bars pointing opposite ways. The Sell signal has been under management for 6 weeks, the short is up just over 4%, and the trend is losing conviction, the ADX has fallen for a fourth straight week.
IQS Phase
62
ordinary
Signal Strength
19
decline starting to make lower lows
Sizing
MINIMUM
Ranking
#61 / 137
US stocks
Trade P&L %
+4.43%
from signal to today
restricted Platinum content