
Newmont: sellers retake control
Newmont drops 5.9% as sellers retake control, but the 90 area double bottom holds
Newmont: sellers retake control
Our view last week
Newmont formed a clean daily double bottom in the 91 area, with an 8% intermediate rebound, but the weekly technical picture stays neutral: volume contracting and two rejection bars pointing opposite ways. The Sell signal has been under management for 6 weeks, the short is up just over 4%, and the trend is losing conviction, the ADX has fallen for a fourth straight week.
This week's summary
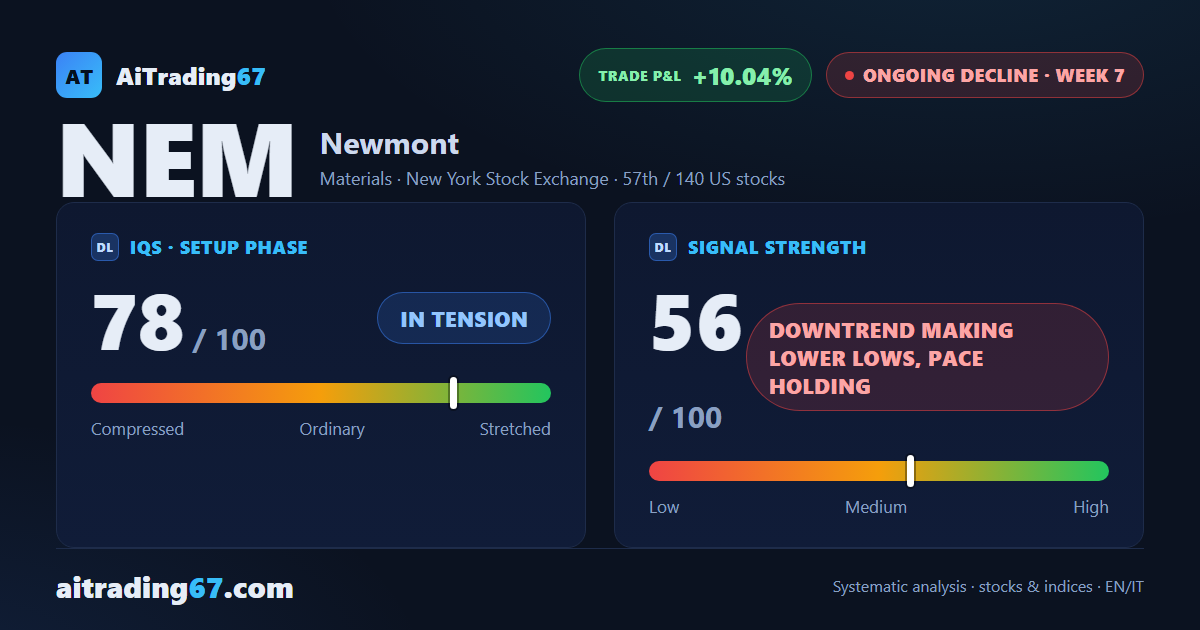
Newmont shares see sellers retake control: 90% of trading on the sell side and a 5.9% weekly drop, with money flow turning sharply negative and the ADX still fading, a fifth straight week of a trend losing its grip. On the daily chart, though, a double bottom holds in the 90 area, with an 11% intermediate rebound. The short, under management for 6 weeks, is now up more than 10%.
IQS Phase
78
in tension
Signal Strength
56
downtrend making lower lows, pace holding
Sizing
STANDARD
Ranking
#57 / 140
US stocks
Trade P&L %
+10.04%
from signal to today
restricted Platinum content