
New Sell signal · US stocks
Newmont drops 4.8%: a Sell signal fires while the 20-week average holds
Our view last week
Newmont stock sheds 1.6% and closes a 3rd straight losing week: sellers dominate the weekly bar outright, with buying dropping below a quarter of volume. The daily chart reads differently, as money flow, just under zero a week ago, turns positive again. In technical analysis terms the underlying trend stays bullish above every weekly moving average, and among our weekly buy signals on US stocks the trade is up 7.5%.
This week's summary
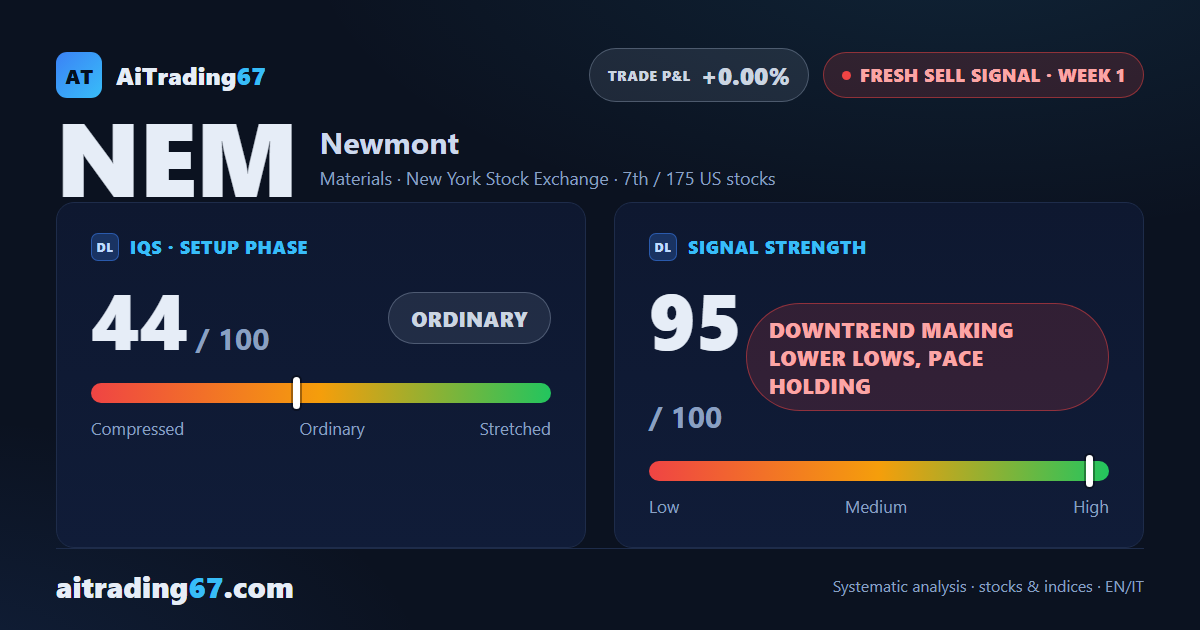
Newmont drops 4.8% and strings together a 4th losing week: a week ago the long trade was still in profit, now a new Sell signal fires. Signal strength, at 95 out of 100, describes a downtrend making lower lows and holding its pace. Newmont stock still sits above every weekly moving average, though, and the 20-week average, in the 114 area, held when touched: in technical analysis terms, opening a short here is high-risk.
IQS Phase
44
ordinary
Signal Strength
95
downtrend making lower lows, pace holding
Sizing
STANDARD
Ranking
#7 / 175
New us stocks
Trade P&L %
+0.00%
from signal to date, no stop loss
Newmont (NEM) weekly chart — EMA50 · MACD · VWAP
Weekly chart · EMA50 · MACD · VWAP · Source: TradingView
Rank position
ranks 7th among the 175 sell signals for US stocks in our ranking, with a signal strength of 95 out of 100.
Sector context
SectorMaterials
Benchmark ETFXLB
Sector regimeweak phase
Performanceweekly -1.89% · monthly -7.72%
NEM belongs to the materials sector (reference ETF XLB). The sector is classified weak phase according to our weekly reading.
restricted Platinum content