
+7.2% rebound, but the model turns cautious
Nexi jumps 7.2% off its 20-day average, but the signal shows cracks
+7.2% rebound, but the model turns cautious
Our view last week
Nexi gives back 3.3% and retests the 3.4 area, the same floor where a double bottom formed last week with a 6% rebound. Sellers dominate the last session and buying pressure is fading, a shift from the 3.8% gain seven days ago. Nexi stock heads into this week's earnings, due July 28, with a more cautious technical picture.
This week's summary
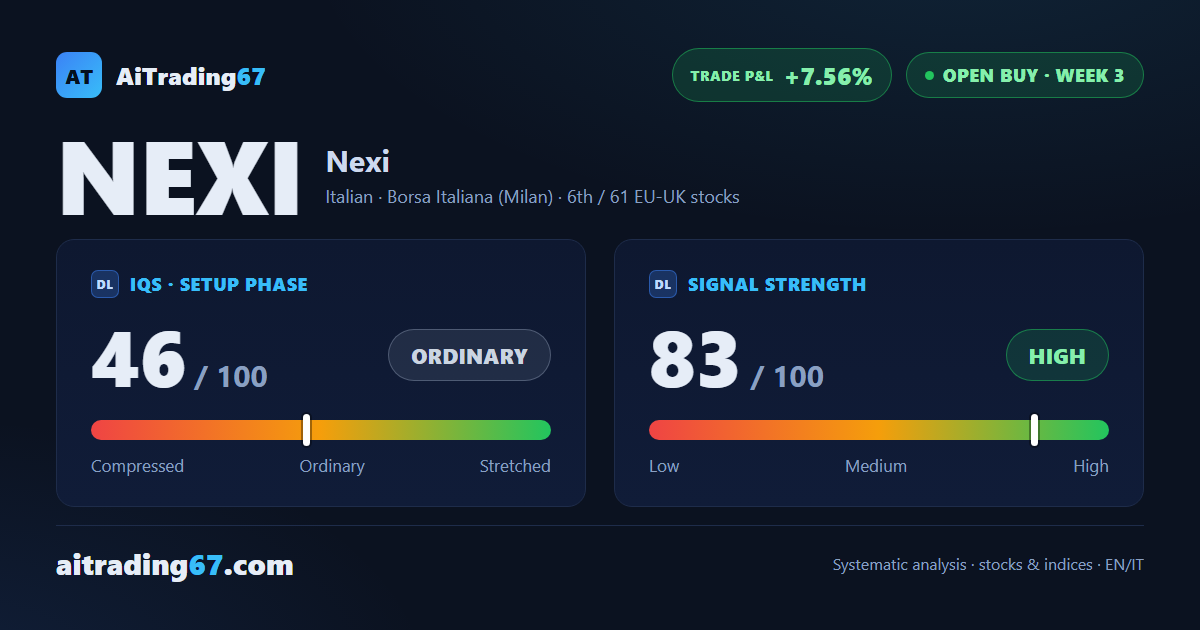
Nexi stock bounces 7.2% this week, with a 6% rebound off the 20-day average in the 4.0 area: a show of strength after last week's floor test. Underneath, though, volumes are contracting and buying pressure is fading. The buy signal, now in its third week, still holds, but our model reads the setup as technically weak despite the price gain.
IQS Phase
46
ordinary
Signal Strength
83
high · wide move
Sizing
FULL
Ranking
#6 / 61
EU-UK stocks in progress
Trade P&L %
+7.56%
from signal to date, no stop loss
Rank position
ranks 6th among the 61 Longs already running for European-UK stocks in our ranking, with a signal strength of 83 out of 100.
Sector context
SectorItalian
Benchmark ETFEXV1
Sector regimein positive regime
Performanceweekly +2.05% · monthly +3.45%
NEXI belongs to the italian sector (reference ETF EXV1). The sector is classified in positive regime according to our weekly reading.
restricted Platinum content