EN IT

National Grid under pressure: decline holds, but the double bottom clouds the picture

National Grid week 5 of a sell signal — weekly technical analysis shows a decline that holds structurally, yet a double bottom in the 1180 area and persistent buy volume create a mixed trade setup with unclear near-term performance.

National Grid under pressure: decline holds, but the double bottom clouds the picture
Week 5 · Sell signal · London Stock Exchange
National Grid under pressure: decline holds, but the double bottom clouds the picture
June 19, 2026
Week 5 · Sell signal · London Stock Exchange
In Summary
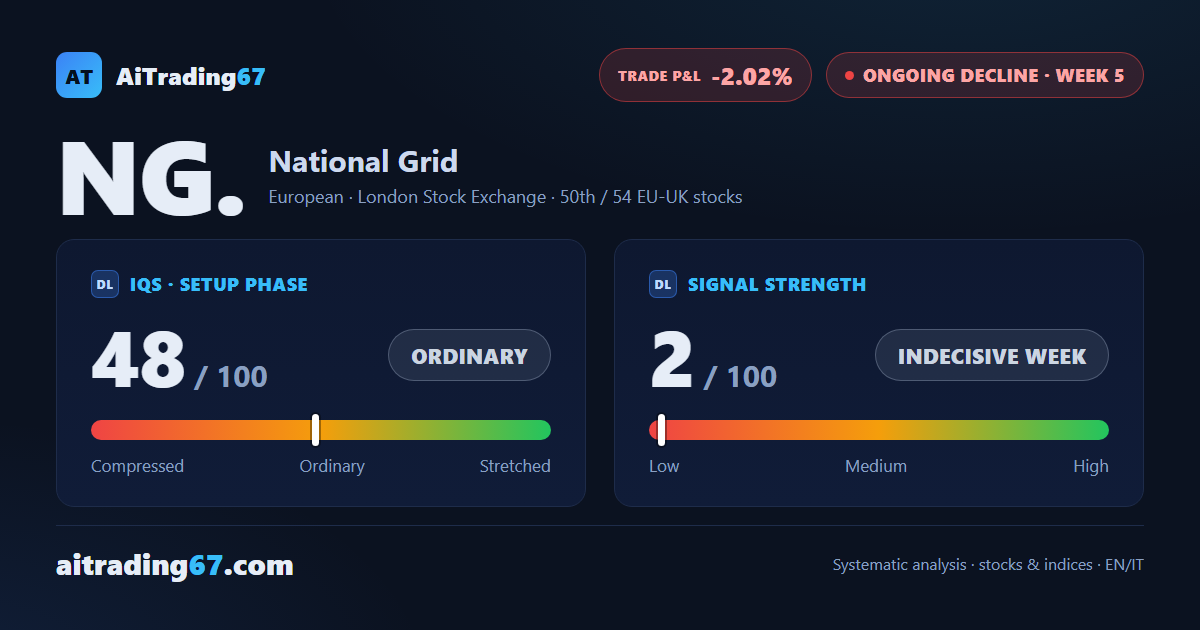
National Grid is at week 5 of a sell signal, with the trade still slightly in the red. The latest week closed marginally higher, but the technical picture is mixed: MACD deteriorating steadily, momentum accelerating to the downside, while buyers have dominated for 3 consecutive weeks and a double bottom is forming in the 1180 area. Trading not recommended; those already short should monitor the setup carefully.
Ongoing decline ·5th week from start ·EU-UK stocks ·T2 ★ See Gold version →
IQS Phase
48
ordinary
Signal Strength
2
indecisive week
Sizing
MINIMUM
Ranking
#50 / 54
EU-UK stocks
Trade P&L %
-2.02%
from signal to today
Chart · Weekly — EMA50 · MACD · VWAP
Weekly chart · EMA50 · MACD · VWAP · Source: TradingView
How to read this pageA visual guide to the post, card by card
The full analysis, operating plan and detailed levels on this asset are reserved for clients ★ PLATINUM
restricted Platinum content
Share WhatsApp Telegram Gmail LinkedIn