
The decline bounces off the double bottom
National Grid rebounds 2.5% as the decline bounces off its 1180 double bottom
The decline bounces off the double bottom
Our view last week
National Grid shares had held up last week, with buying flow still intact; this week the picture flipped — just 17% of trading was on the buy side, 83% on the sell side — and the stock slipped 1.4%, back near the 1180 double bottom. The Sell signal, now in its 9th week, remains 3.2% underwater: weekly technical analysis shows a trend losing conviction, with the ADX declining for four straight weeks.
This week's summary
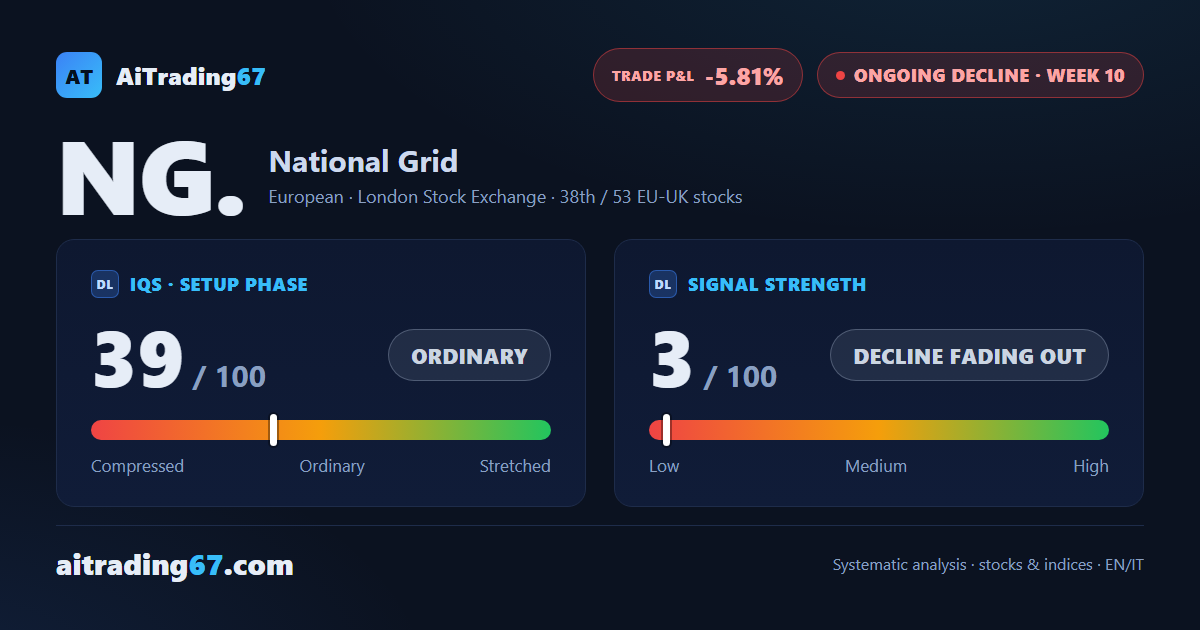
National Grid has flipped the script from a week ago: after 83% of trading was on the sell side last week, this week the flow reversed to 91% on the buy side, and the stock recovered 2.5%, bouncing right off the 1180 double bottom. The Sell signal, now in its 10th week under management, remains underwater — down 5.81% now — while the ADX keeps declining: the decline still holds its direction, but the signs of fatigue keep piling up.
IQS Phase
39
ordinary
Signal Strength
3
decline fading out
Sizing
MINIMUM
Ranking
#38 / 53
EU-UK stocks
Trade P&L %
-5.81%
from signal to today
restricted Platinum content