
National Grid: the decline loses steam, money flow flips
National Grid drops 1.6%, pinned under its 50-day average
National Grid: the decline loses steam, money flow flips
Our view last week
National Grid has flipped the script from a week ago: after 83% of trading was on the sell side last week, this week the flow reversed to 91% on the buy side, and the stock recovered 2.5%, bouncing right off the 1180 double bottom. The Sell signal, now in its 10th week under management, remains underwater — down 5.81% now — while the ADX keeps declining: the decline still holds its direction, but the signs of fatigue keep piling up.
This week's summary
National Grid's bounce has already faded: after last week's recovery, the stock gave back 1.6% this week and got boxed into a very tight band, between the 50-day moving average resistance and the daily Bollinger midline support, both a whisker from price. Money flow, though, turned firmly positive, and the ADX keeps sliding: the Sell signal, in its 11th week of management, keeps piling up signs of fatigue. Weekly technical analysis worth following closely.
IQS Phase
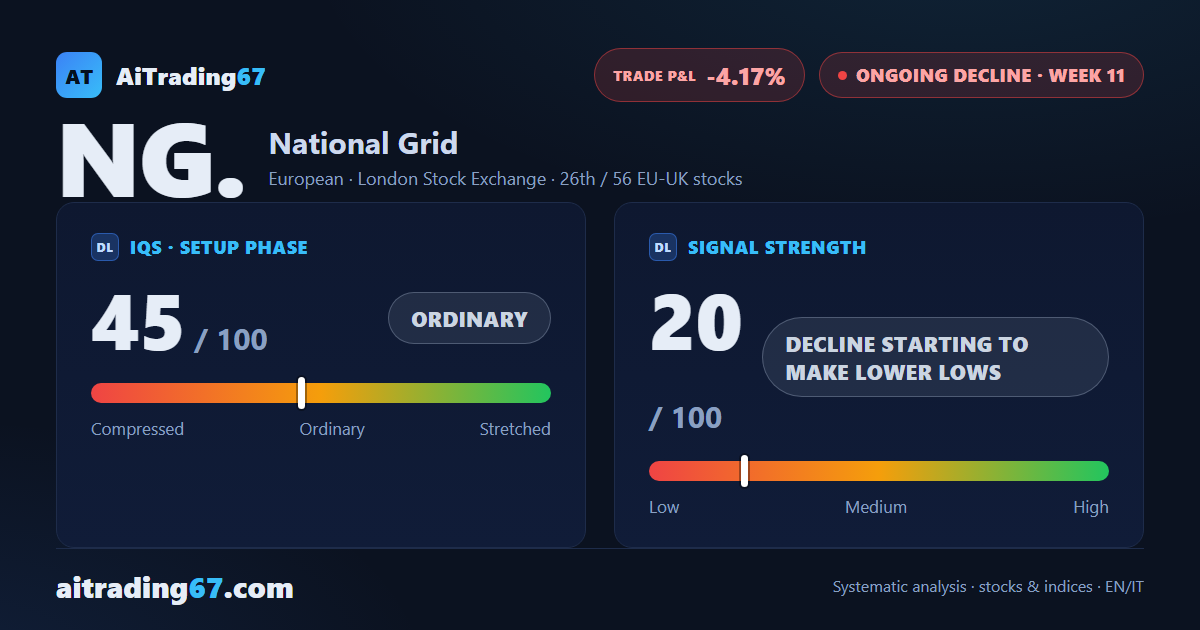
45
ordinary
Signal Strength
20
decline starting to make lower lows
Sizing
MINIMUM
Ranking
#26 / 56
EU-UK stocks
Trade P&L %
-4.17%
from signal to today
Rank position
ranks 26th among the 56 sell signals for European-UK stocks in our ranking, with a signal strength of 20 out of 100.
Sector context
SectorEuropean
Benchmark ETFEXH9
Sector regimein positive regime
Performanceweekly +0.44% · monthly +3.14%
NG. belongs to the european sector (reference ETF EXH9). The sector is classified in positive regime according to our weekly reading.
restricted Platinum content