
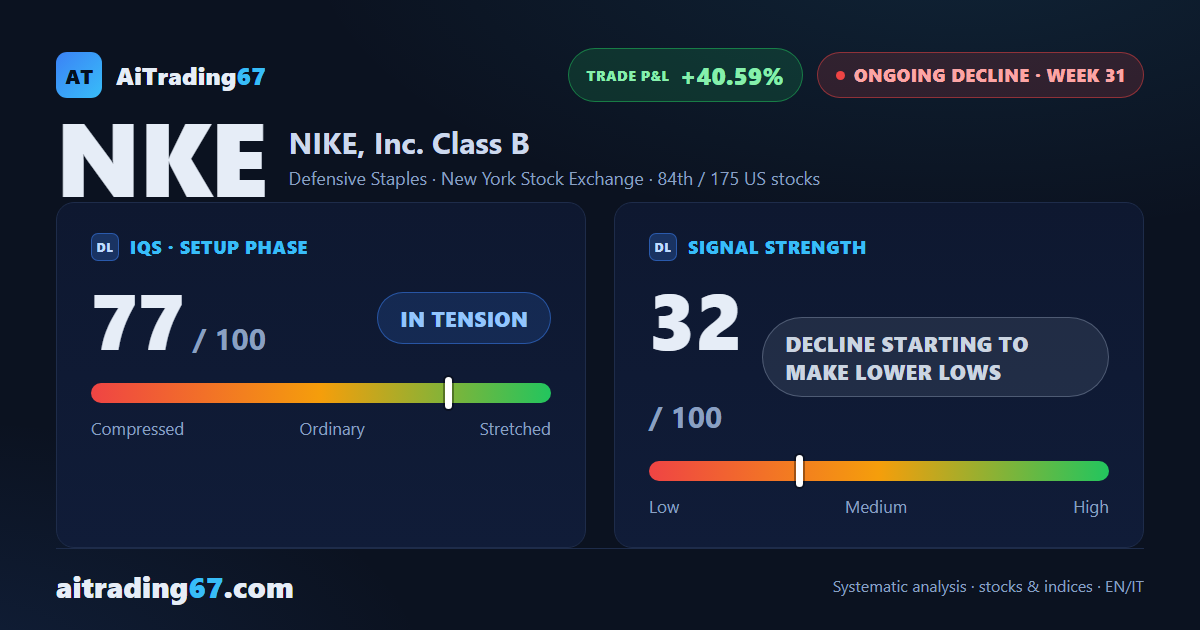
Ongoing decline · week 31 of the Sell signal
Nike drops 5.3% and closes below its previous 90-week low
Our view last week
After 4 red weeks Nike closes up 0.7%, and buyers climb back to 29% of volume from just 1% a week earlier. It's a breather inside a decline that is still intact: the weekly MACD slips below its Signal line, money flow keeps sinking and the ADX rises for a 17th week. Nike stock technical analysis shows price action still in distribution, with the weekly RSI below 30 and earnings on October 1 in the week ahead.
This week's summary
Nike falls 5.3% and prints a new 90-week low, in the 32 area, confirmed by a weekly close below the previous low. Last week's breather is already behind us and the trade setup stays on the sell side: the ADX rises for an 18th week, the MACD holds below its Signal line and the weekly RSI drops to 26. Among US stocks, Nike stock technical analysis shows price action still in distribution, with one contrary hint: the last session closed near its high.
IQS Phase
77
in tension
Signal Strength
32
decline starting to make lower lows
Sizing
REDUCED
Ranking
#84 / 175
US stocks
Trade P&L %
+40.59%
from signal to date, no stop loss
NIKE (NKE) weekly chart — EMA50 · MACD · VWAP
Weekly chart · EMA50 · MACD · VWAP · Source: TradingView
Rank position
ranks 84th among the 175 sell signals for US stocks in our ranking, with a signal strength of 32 out of 100.
Sector context
SectorDefensive Staples
Benchmark ETFXLP
Sector regimeweak phase
Performanceweekly -1.86% · monthly -5.85%
NKE belongs to the defensive staples sector (reference ETF XLP). The sector is classified weak phase according to our weekly reading.
restricted Platinum content