
Nokia bounces, the sell signal loses steam
Nokia rebounds 3.1% as its sell signal's strength drops to 29
Nokia bounces, the sell signal loses steam
Our view last week
A fresh sell signal hits Nokia, in its 1st week and ranking 62nd among the 137 US sell signals. The week just closed gave up 7.2%, and the decline is making lower lows: signal strength climbs to 75 out of 100. The setup stays high-risk per our model, with the setup quality indicator at 70 out of 100, in a maturity tension phase.
This week's summary
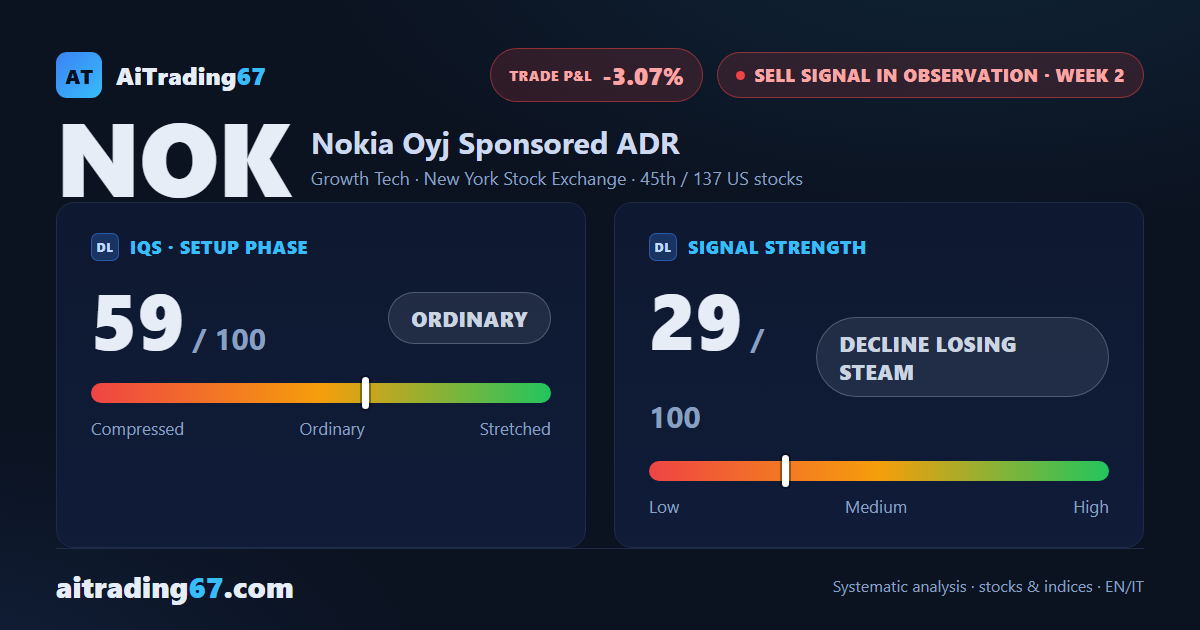
Nokia's stock sits at the center of a sell signal in its second week, and this week already changed its pace: the stock bounced 3.1%, with a clean daily double bottom and a 15% rebound off the lows. Signal strength drops to 29 out of 100 — a decline losing steam. The setup stays high-risk per our model, with earnings approaching in two weeks.
Sell signal in observation
·2nd week from start
·US stocks
·T2
·📅 Earnings · Jul 23
★ See Gold version →
IQS Phase
59
ordinary
Signal Strength
29
decline losing steam
Sizing
MINIMUM
Ranking
#45 / 137
US stocks sell signals
Trade P&L %
-3.07%
from signal to today
restricted Platinum content