
Nokia drops 18.6%, the downtrend regains its edge
Nokia sheds 18.6% in a week as the sell signal regains its momentum
Nokia drops 18.6%, the downtrend regains its edge
Our view last week
Nokia's stock sits at the center of a sell signal in its second week, and this week already changed its pace: the stock bounced 3.1%, with a clean daily double bottom and a 15% rebound off the lows. Signal strength drops to 29 out of 100 — a decline losing steam. The setup stays high-risk per our model, with earnings approaching in two weeks.
This week's summary
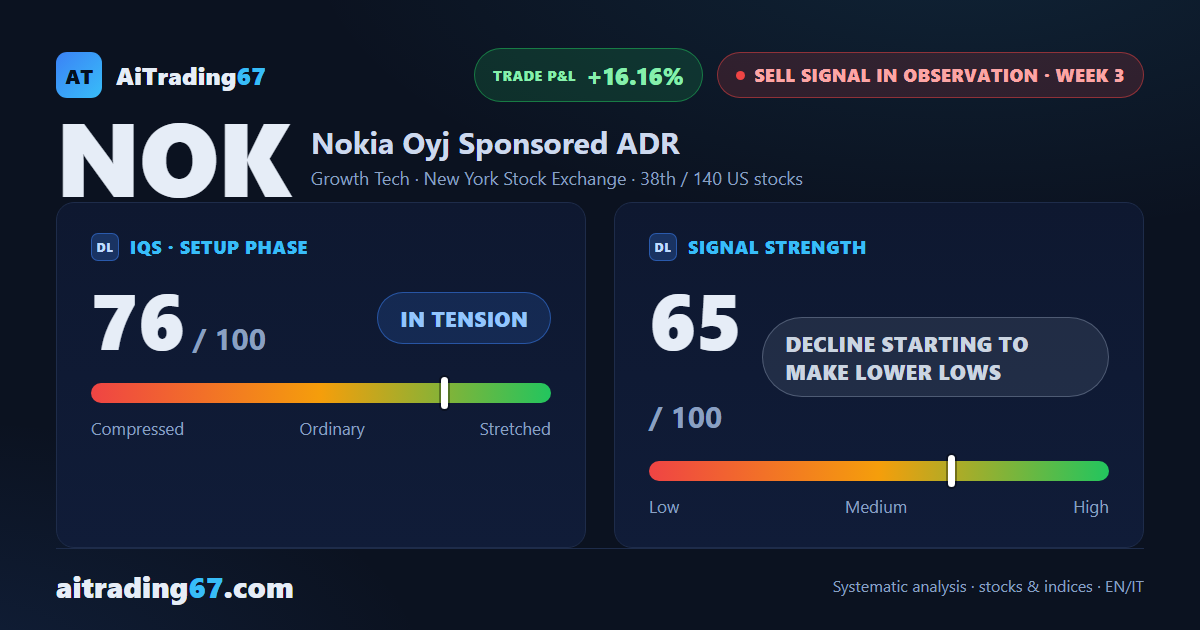
Nokia shares dropped 18.6% this week, reversing last week's bounce: five straight lower highs pulled the price from the 15 area down toward 12, with sellers dominating the last session. Signal strength for the sell signal is back up to 65 out of 100, up from 29 last week -- the decline is regaining pace with lower lows. In our weekly technical analysis on Nokia stock, the price still sits 65% above its 200-week average, and the quality band flags trading as not recommended.
Sell signal in observation
·3rd week from start
·US stocks
·T2
·📅 Earnings · Jul 23
★ See Gold version →
IQS Phase
76
in tension
Signal Strength
65
decline starting to make lower lows
Sizing
STANDARD
Ranking
#38 / 140
US stocks sell signals
Trade P&L %
+16.16%
from signal to today
restricted Platinum content