
EN IT

ServiceNow under pressure: new sell signal, elevated-risk setup

ServiceNow week 1 sell signal — technical analysis shows a bearish weekly structure, setup quality indicator at 66, shallow drop, and a daily double bottom complicating the trade setup picture.

ServiceNow under pressure: new sell signal, elevated-risk setup
ServiceNow · Week 1 sell signal
ServiceNow under pressure: new sell signal, elevated-risk setup
June 26, 2026
ServiceNow · Week 1 sell signal
In Summary
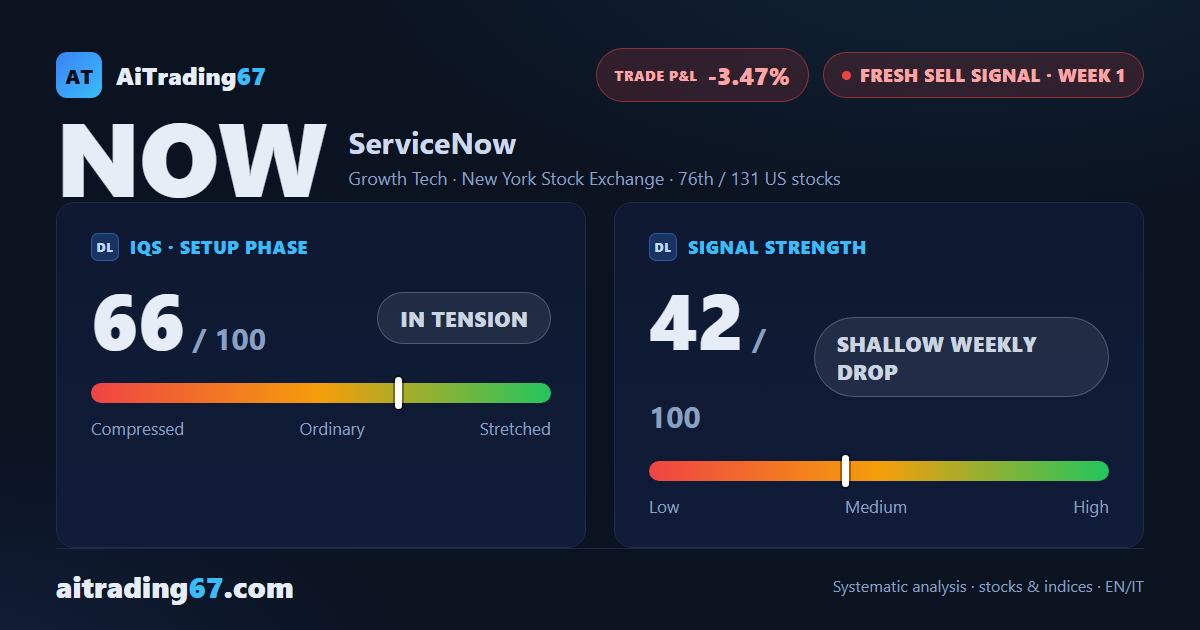
A new sell signal has arrived on ServiceNow in week 1: bearish weekly structure, setup quality indicator at 66 out of 100 in tension, a shallow weekly drop. On the daily chart, a double bottom in the 87 area with a 63% intermediate rebound complicates new short entries. The quality band flags elevated risk, and the stock ranks 76th among 131 sell signals for US stocks.
Fresh sell signal ·1st week from start ·US stocks ·T2 ★ See Gold version →
IQS Phase
66
in tension
Signal Strength
42
shallow weekly drop
Sizing
REDUCED
Ranking
#76 / 131
New us stocks
Trade P&L %
-3.47%
from signal to today
Chart · Weekly — EMA50 · MACD · VWAP
Weekly chart · EMA50 · MACD · VWAP · Source: TradingView
How to read this pageA visual guide to the post, card by card
The full analysis, operating plan and detailed levels on this asset are reserved for clients ★ PLATINUM
restricted Platinum content
Share WhatsApp Telegram Gmail LinkedIn