
Sell signal loses steam, up 1.3% this week
ServiceNow rises 1.3% as its sell signal's strength collapses to 2 out of 100
Sell signal loses steam, up 1.3% this week
Our view last week
ServiceNow closes the week up 8.1%, the third week of a sell signal that has run out of steam: strength drops to 2 out of 100. The stock ranks 126th among 137 US sell signals, and the quality band still flags trading as not recommended on a highly volatile name.
This week's summary
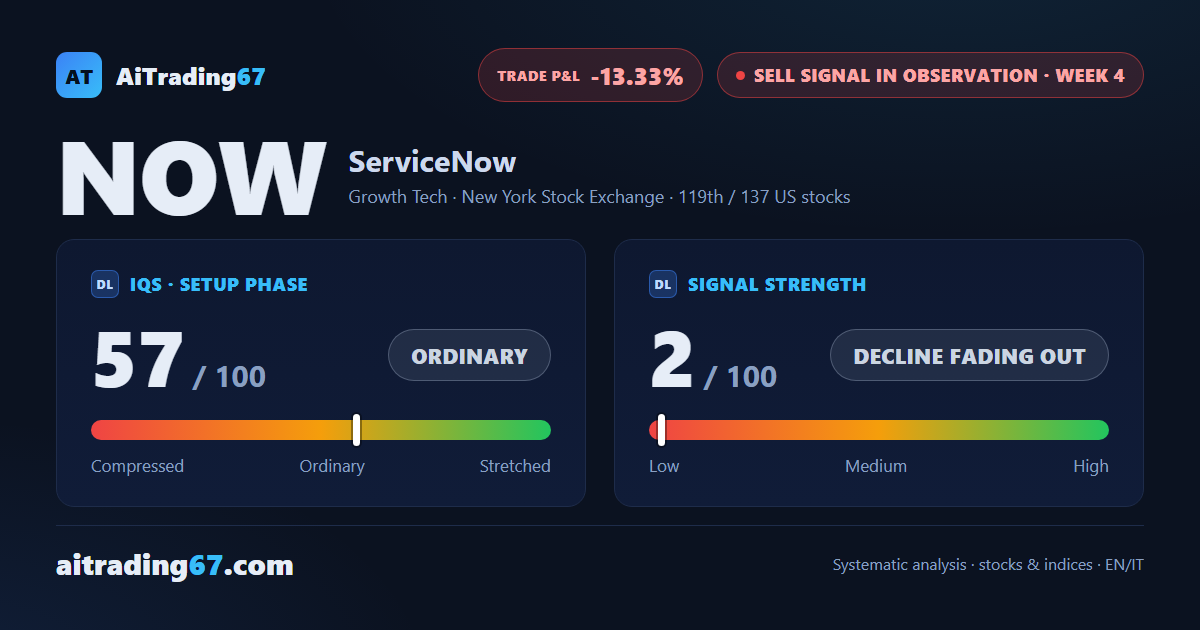
ServiceNow's rebound off a double bottom in the 91 area keeps going: this week's technical analysis shows another 1.3% gain, with price climbing back toward the Inversion Point. Signal strength on the sell signal has dropped to 2 out of 100 — "decline fading out" — as the weekly MACD improves. Setup quality stays ordinary, and ServiceNow has slipped to 119th among the 137 US sell signals.
Sell signal in observation
·4th week from start
·US stocks
·T2
·📅 Earnings · Jul 29
★ See Gold version →
IQS Phase
57
ordinary
Signal Strength
2
decline fading out
Sizing
MINIMUM
Ranking
#119 / 137
US stocks sell signals
Trade P&L %
-13.33%
from signal to today
restricted Platinum content