
Novo Nordisk: steady buy, up 12.76%
Novo Nordisk dips 1.9% and its buy signal stays solid in week 10
Novo Nordisk: steady buy, up 12.76%
Our view last week
Novo Nordisk is in week 9 of a buy signal, with the trade up 14.93% since entry. The stop has moved to breakeven, zeroing out the position's risk. Signal strength stays medium at 66 out of 100, and the stock ranks 43rd among the 125 US buy signals already running. The next management window arrives as soon as next week.
This week's summary
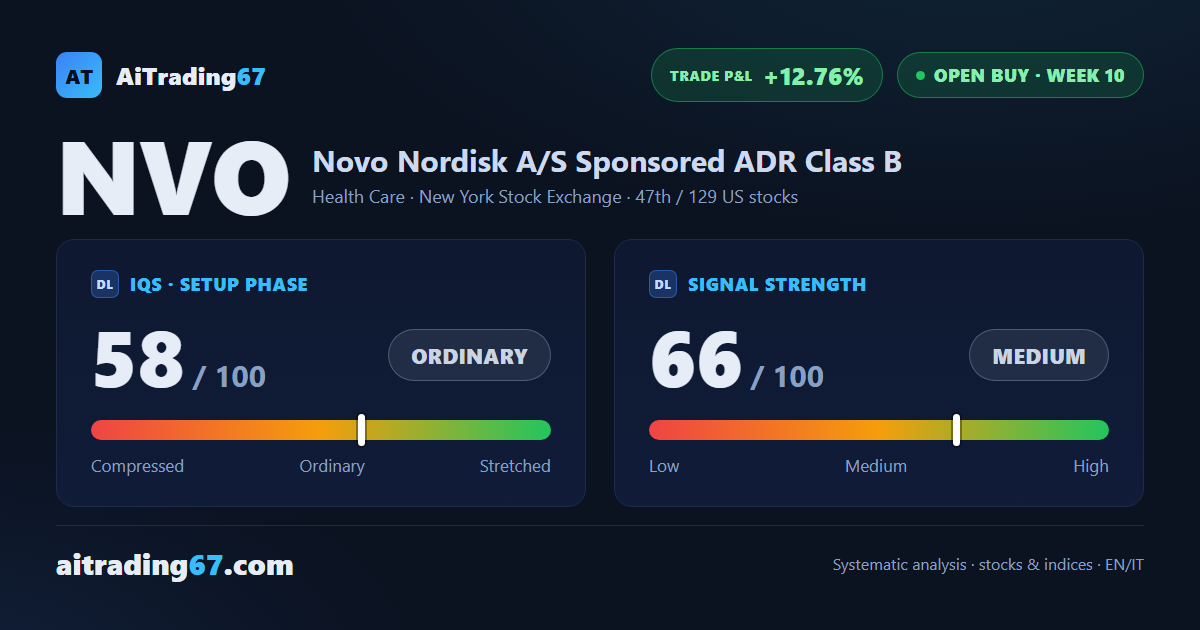
Novo Nordisk shares slipped 1.9% this week, squeezed into a tight band between resistance in the 49.5 area (the 200-day moving average) and support in the 49.3 area (the daily pivot average). On the daily chart, though, buyers stay in control, with 82% of volume on the buy side, and the weekly MACD keeps improving. The technical picture stays bullish underneath: the buy signal is now in its 10th week, with the trade up 12.76% since entry.
IQS Phase
58
ordinary
Signal Strength
66
medium
Sizing
STANDARD
Ranking
#47 / 129
US stocks in progress
Trade P&L %
+12.76%
from signal to today
restricted Platinum content