
Novo Nordisk presses against the breakout trigger
Novo Nordisk gains 1.7% and closes in on its breakout trigger near 52
Novo Nordisk presses against the breakout trigger
Our view last week
Novo Nordisk shares slipped 1.9% this week, squeezed into a tight band between resistance in the 49.5 area (the 200-day moving average) and support in the 49.3 area (the daily pivot average). On the daily chart, though, buyers stay in control, with 82% of volume on the buy side, and the weekly MACD keeps improving. The technical picture stays bullish underneath: the buy signal is now in its 10th week, with the trade up 12.76% since entry.
This week's summary
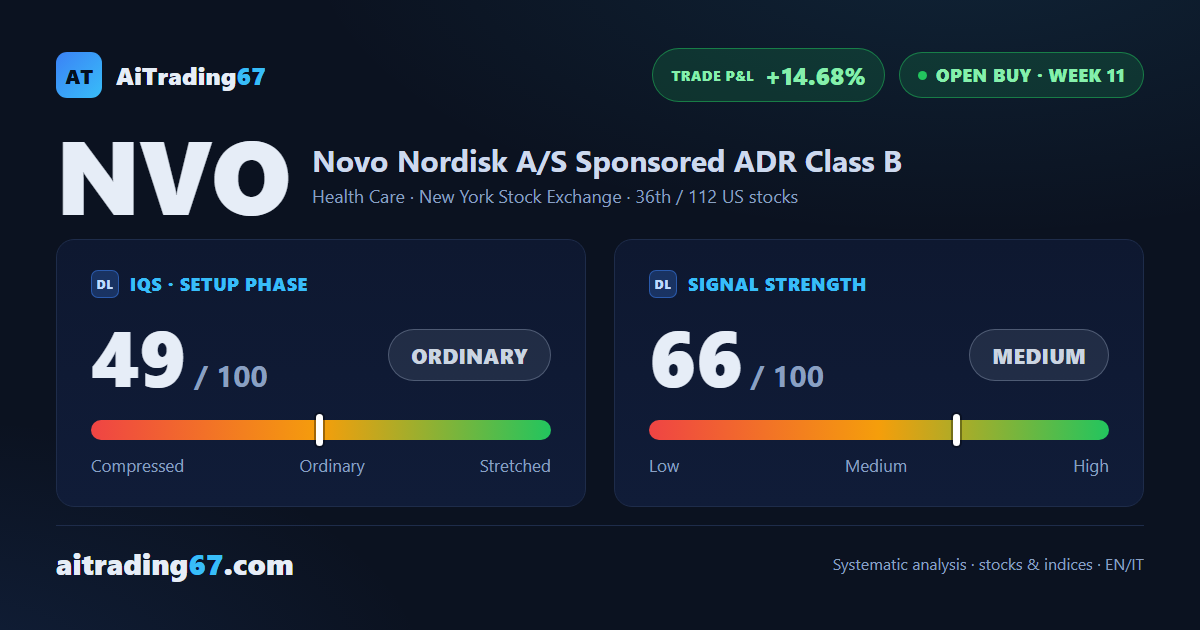
Novo Nordisk shares gain 1.7% and are now pressing right up against the breakout trigger in the 52 area, after the double bottom in the 42 area that already produced a 10% rebound. On the daily chart money flow stays positive, but volume is contracting and buyer dominance is fading just below resistance. Weekly technical analysis: the trade sits at +14.7% since entry, ranked 36th among the 112 US Longs.
IQS Phase
49
ordinary
Signal Strength
66
medium
Sizing
STANDARD
Ranking
#36 / 112
US stocks in progress
Trade P&L %
+14.68%
from signal to today
restricted Platinum content