
Sell signal, week 2 · US stocks
Occidental Petroleum climbs 2.1% and the Sell signal is left without a push
Our view last week
Two down weeks in a row, the latest worth 3.4%, and a weekly MACD slipping below its Signal line after 5 weeks above it: Occidental Petroleum flips to a fresh sell signal after 9 weeks on the buy side. In this technical analysis of Occidental Petroleum stock, price action has passed to the sellers, yet the price holds above its 50-week average and weekly money flow is still positive: for our model, opening a short here is high-risk.
This week's summary
After 2 down weeks Occidental Petroleum bounces 2.1%: price slid into the 55 area and recovered 6% from there, back onto its 20-day moving average. Last week's sell signal loses its push, while the weekly MACD stays below its Signal line. In this technical analysis of Occidental Petroleum stock, price action turns uncertain and price holds above its 50-week average: among US stocks, our model rates a fresh short here as high-risk.
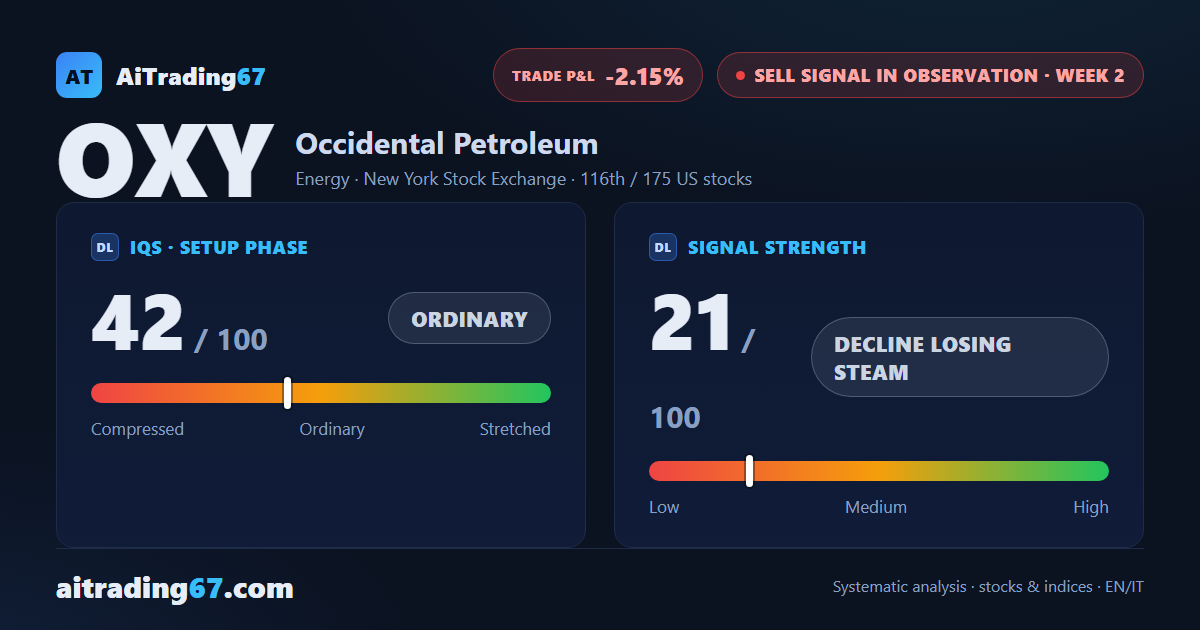
IQS Phase
42
ordinary
Signal Strength
21
decline losing steam
Sizing
MINIMUM
Ranking
#116 / 175
US stocks sell signals
Trade P&L %
-2.15%
from signal to date, no stop loss
Occidental Petroleum (OXY) weekly chart — EMA50 · MACD · VWAP
Weekly chart · EMA50 · MACD · VWAP · Source: TradingView
Rank position
ranks 116th among the 175 sell signals for US stocks in our ranking, with a signal strength of 21 out of 100.
Sector context
SectorEnergy
Benchmark ETFXLE
Sector regimein positive regime
Performanceweekly +1.26% · monthly -3.50%
OXY belongs to the energy sector (reference ETF XLE). The sector is classified in positive regime according to our weekly reading.
restricted Platinum content