
S&P 100 ETF: the Sell signal is fading out
iShares S&P 100 climbs 1.7%: the Sell signal is nearly spent
S&P 100 ETF: the Sell signal is fading out
Our view last week
The iShares S&P 100 ETF is at week 2 of a sell signal, and the week just closed gained 2.4%: signal strength has slipped to 36 out of 100, a decline losing steam rather than one still pushing lower. The setup quality indicator sits at 55 out of 100, in the ordinary range, and the fund ranks 107th among the 137 US sell signals.
This week's summary
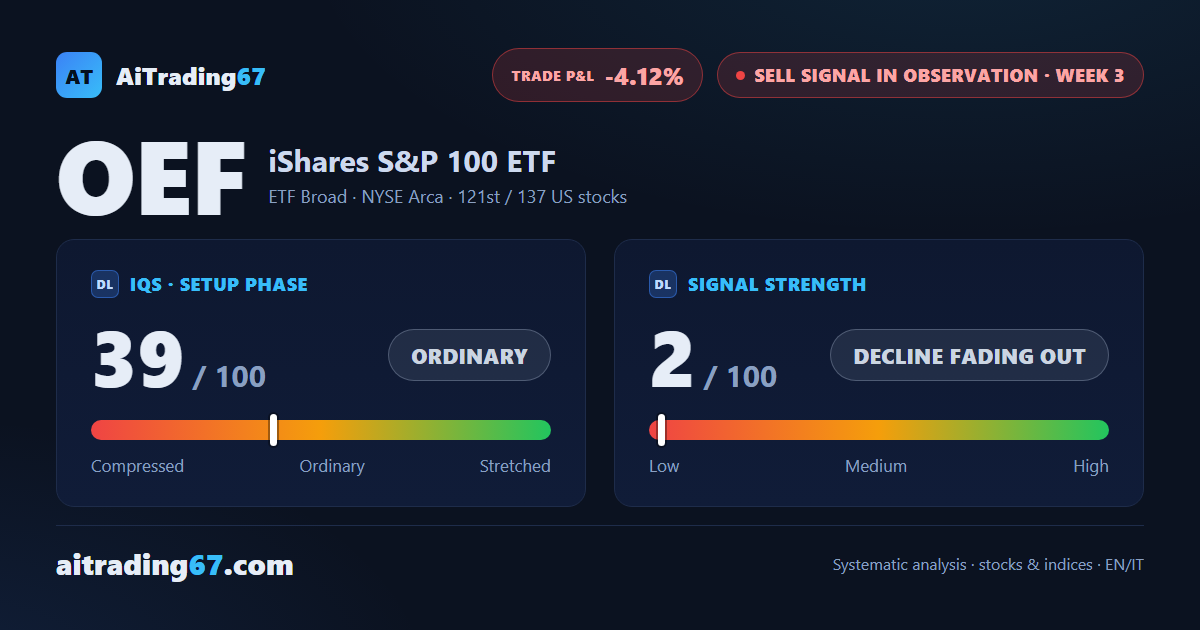
The iShares S&P 100 ETF (OEF) closed the week up 1.7%, with a clean double bottom in the 356 area and a 5% rebound: on the daily chart buyers control 94.9% of volume. The Sell signal keeps losing ground — strength drops to 2 out of 100, a decline running on fumes — while the fund stays 34.7% above its 200-week average, hugging its highs. Weekly technical analysis: trading not recommended.
IQS Phase
39
ordinary
Signal Strength
2
decline fading out
Sizing
MINIMUM
Ranking
#121 / 137
US stocks sell signals
Trade P&L %
-4.12%
from signal to today
restricted Platinum content