
Oi: decline continues, RSI near the floor
Oi drops another 9.1% as the Sell signal shows no sign of easing
Oi: decline continues, RSI near the floor
Our view last week
Oi's stock tried to attack its 7-day high, in the 0.80 area, and was firmly rejected: the week closed down 17.5%, the sharpest drop of the last four readings. The Sell signal, under management for 19 weeks, still leaves the short more than 50% in profit.
This week's summary
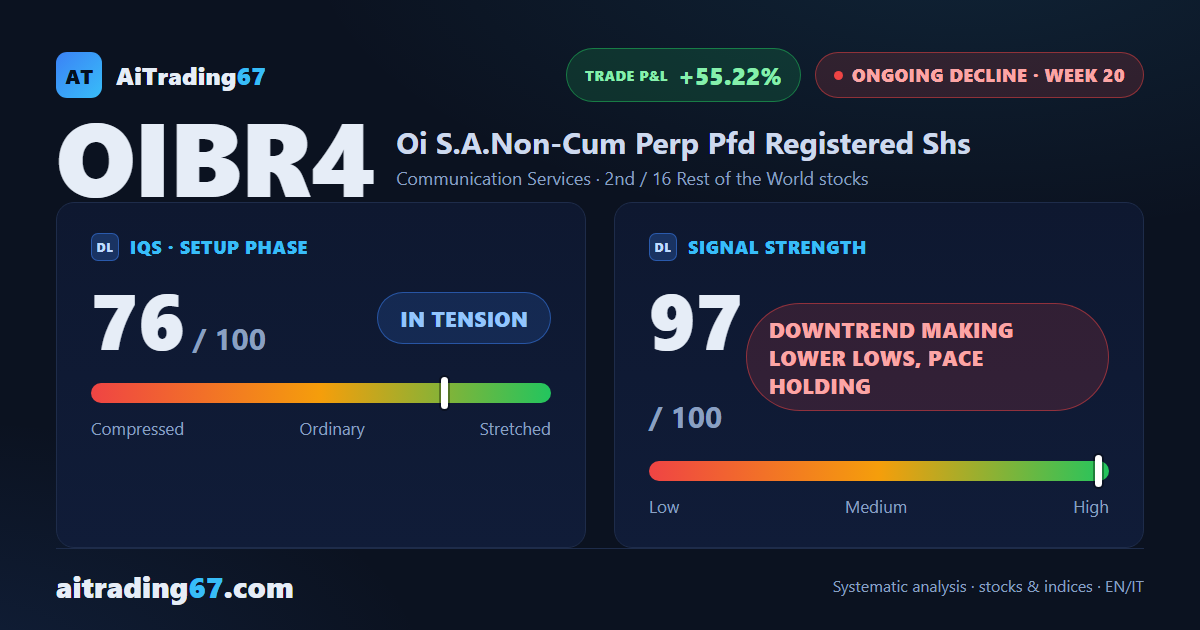
Oi's Sell signal has been under management for 20 weeks, with the short past 55% in profit. After last week's rejection at its 7-day high, the stock dropped another 9.1%: the decline presses on without let-up, the weekly RSI has caved to 20.7, and all of last session's volume was on the sell side.
Ongoing decline
·20th week from start
·Rest of the World stocks
·T2
·📅 Earnings · Aug 12 (est.)
★ See Gold version →
IQS Phase
76
in tension
Signal Strength
97
downtrend making lower lows, pace holding
Sizing
STANDARD
Ranking
#2 / 16
Rest of the World stocks
Trade P&L %
+55.22%
from signal to today
restricted Platinum content