
Sell signal in observation
Ondas slips 2% as the double-bottom bounce fades under seller pressure
Sell signal in observation
Our view last week
Ondas Inc. is in week 2 of a sell signal, and the week just closed down 5.4% without breaking below the prior lows. Signal strength holds flat at 40 out of 100, an isolated drop rather than a decline building momentum. The setup quality indicator sits at 79 out of 100, in a tension-of-maturity phase, and the stock ranks 27th among the 137 US sell signals.
This week's summary
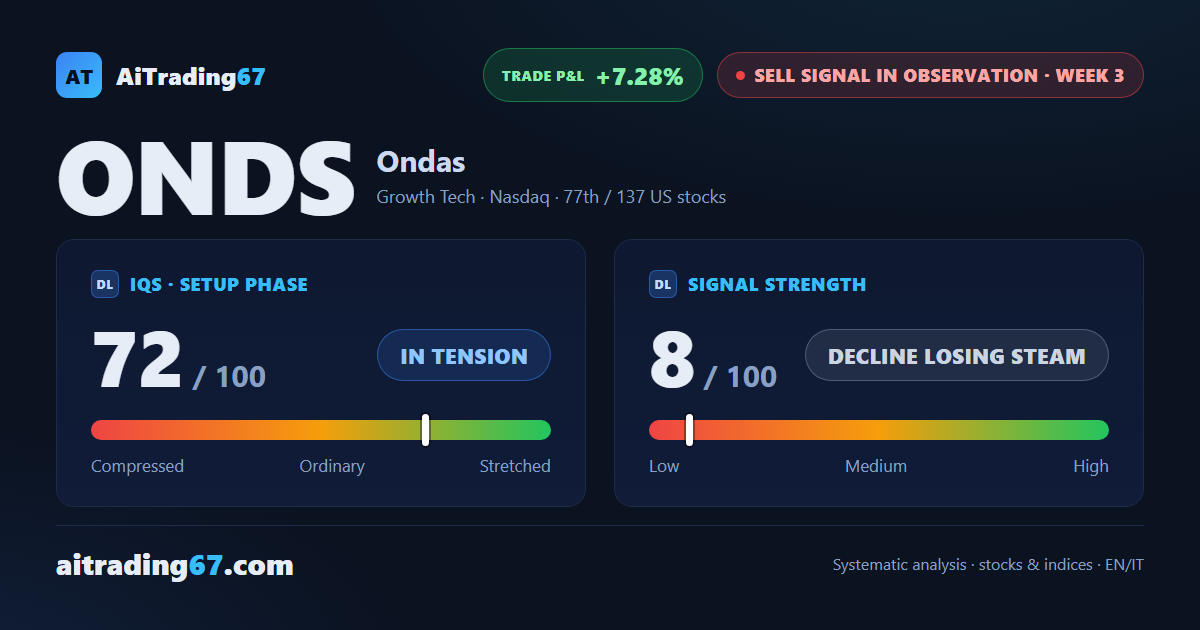
Ondas attempted a 20% rebound off the double bottom in the 7.3 area, but the week still closed down 2%: sellers came roaring back in the last bar, with distribution still underway. Signal strength drops to 8 out of 100 — the lowest so far — a sign of a decline with no fresh push. Trading a fresh short here is not recommended by our model.
IQS Phase
72
in tension
Signal Strength
8
decline losing steam
Sizing
MINIMUM
Ranking
#77 / 137
US stocks sell signals
Trade P&L %
+7.28%
from signal to today
restricted Platinum content