
Orange's sell signal loses steam
Orange (+0.1%): the decline stalls after weeks of lower lows
Orange's sell signal loses steam
Our view last week
Orange is in week 3 of a sell signal, and the week just closed down 6.6%: the decline keeps making lower lows, with signal strength at 56 out of 100. The stock ranks 15th among the 54 European-UK sell signals, in a sector currently going through a weak patch. Our model flags the setup as high risk to open.
This week's summary
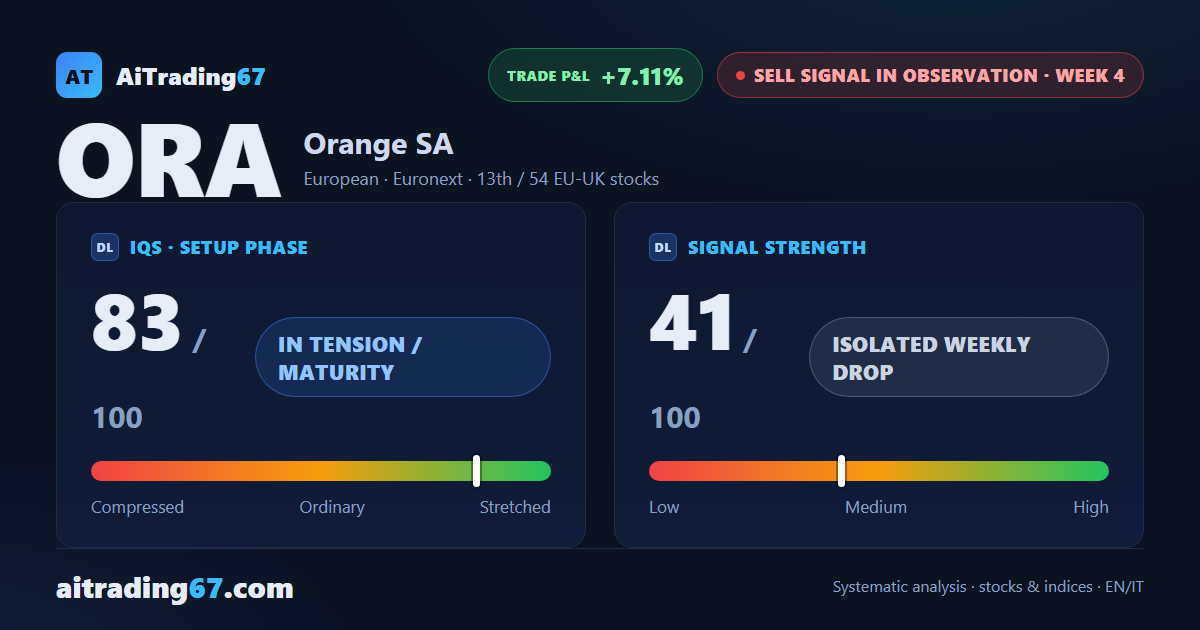
Orange's decline stalls: after weeks of lower lows, the week just closed almost flat, +0.1%, with a clean double bottom in the 16 area on the daily chart and a 5% rebound. The Sell signal, now in its fourth week, is losing steam — strength at 41 out of 100, down from 56 a week ago — while the weekly ADX loses conviction. Orange shares sit 13th among the 54 European-UK sell signals; our model flags opening here as high risk.
Sell signal in observation
·4th week from start
·EU-UK stocks
·T2
·📅 Earnings · Jul 28
★ See Gold version →
IQS Phase
83
in tension / maturity
Signal Strength
41
isolated weekly drop
Sizing
REDUCED
Ranking
#13 / 54
EU-UK stocks sell signals
Trade P&L %
+7.11%
from signal to today
restricted Platinum content