
8.1% bounce tightens the decline
Occidental Petroleum: +8.1% squeezes the sell signal between two key levels
8.1% bounce tightens the decline
Our view last week
Occidental Petroleum is in week 12 of a sell signal, and the trade stays in management. The week closed down 2.2% with sell volume at 57%, lighter than the peaks of the prior two weeks, but capital flow and relative strength keep deteriorating: the decline shows no sign of giving up ground yet.
This week's summary
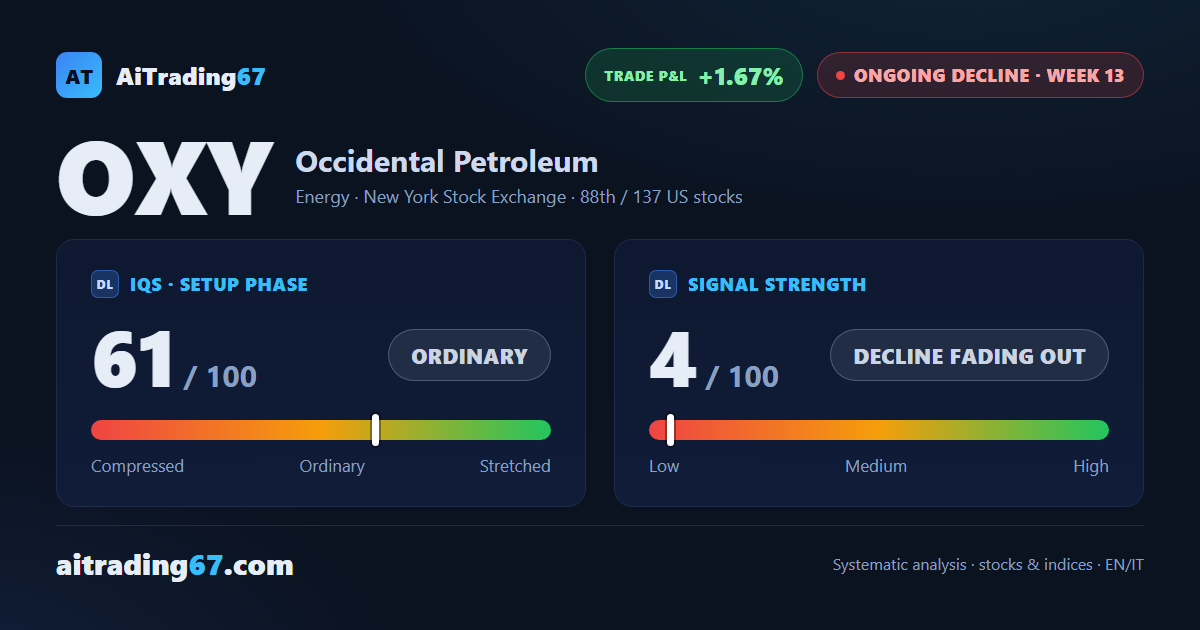
After weeks of steady deterioration, Occidental Petroleum just had a technical turning point: the stock jumped 8.1%, with buyers taking 68% of the week's volume and the weekly RSI back above 50. Price is now pinned in a tight band between the 52.6 and 53.6 areas, a step from the Inversion Point. The sell signal, now in its 13th week, is down to just a 1.67% gain: money flow stays negative, and next week will tell whether the bounce holds.
IQS Phase
61
ordinary
Signal Strength
4
decline fading out
Sizing
MINIMUM
Ranking
#88 / 137
US stocks
Trade P&L %
+1.67%
from signal to today
restricted Platinum content